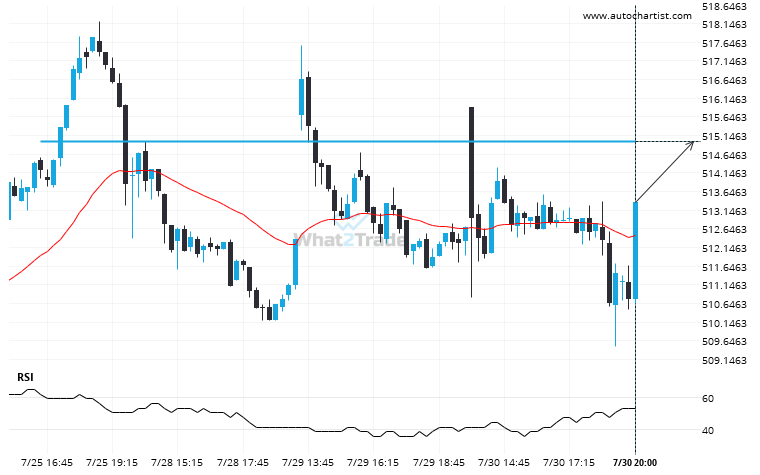
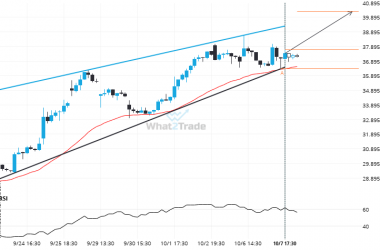
MSFT is moving towards a resistance line. Because we have seen it retrace from this level in the past, we could see either a break through this line, or a rebound back to current levels. It has touched this line numerous times in the last 6 days and may test it again within the next 5 hours.
ARTÍCULOS RELACIONADOS
Rare set of bearish consecutive candles on the AMZN 4 hour chart. Can we expect a turn-around?
For those of you that don’t believe in trends, this may be an opportunity to take advantage of…
CVX is signaling a possible trend reversal on the intraday charts with price not breaching resistance.
CVX is heading towards the support line of a Rising Wedge. If this movement continues, the price of…
INTC hits 20.4100 after a run of 6 consecutive 4 hour candles spanning 6 days.
Due to the rate of consecutive bearish candles on INTC 4 hour chart we could be in for…