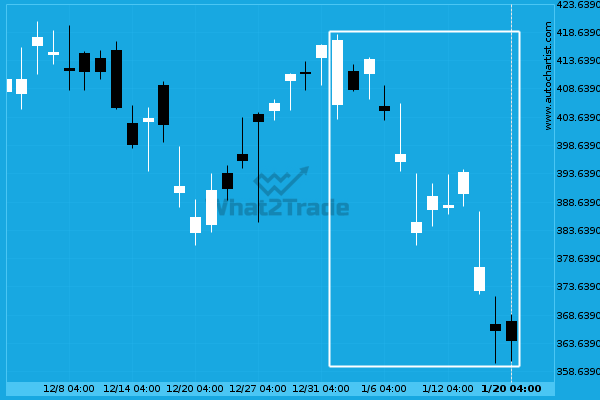
Home Depot Inc. has moved lower by 12.75% from 405.71 to 364.02 in the last 18 days.
ARTÍCULOS RELACIONADOS
V is signaling a possible trend reversal on the intraday charts with price not breaching resistance.
Emerging Triangle pattern in its final wave was identified on the V 4 hour chart. After a strong…
If you’re short XOM you should be aware that 112.4750 has just been breached – a level tested 3 time in the past
XOM has broken through a resistance line. It has touched this line numerous times in the last 27…
PFE has broken out from the Triangle pattern. Expect it to hit 23.7906 soon.
The last 46 4 hour candles on PFE formed a Triangle pattern and broken out through the pattern…