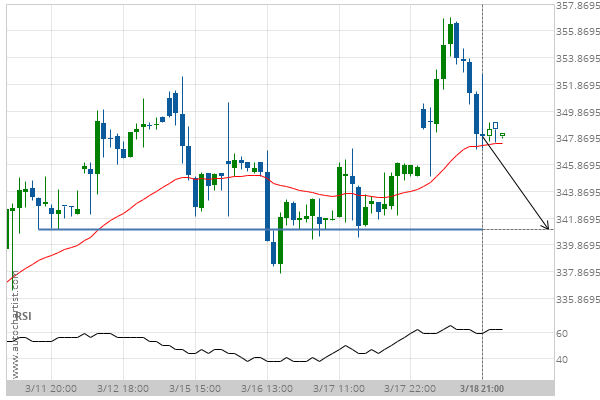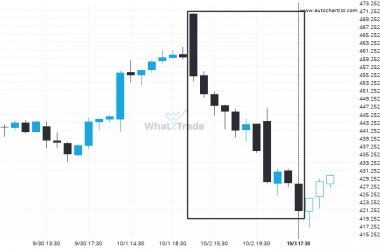
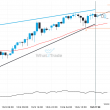
Goldman Sachs Group Inc. is heading towards a line of 341.01. If this movement continues, we expect the price of Goldman Sachs Group Inc. to test 341.01 within the next 13 hours. But don’t be so quick to trade, it has tested this line numerous times in the past, so this movement could be short-lived and end up rebounding just like it did in the past.
Goldman Sachs Group Inc. is quickly approaching 341.01. We expect either a breakout through this line, or a rebound.