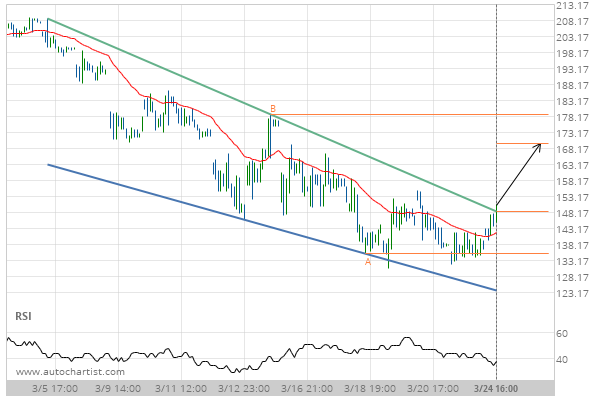
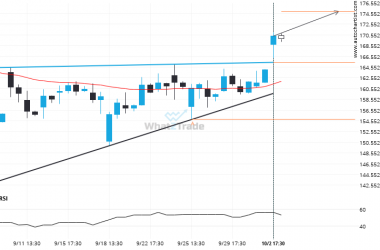
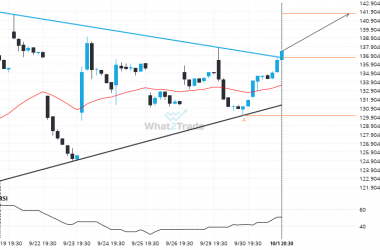
Goldman Sachs Group Inc. has broken through the resistance line of a Channel Down technical chart pattern. Because we have seen it retrace from this position in the past, one should wait for confirmation of the breakout before trading. It has touched this line twice in the last 20 days and suggests a target line to be around 169.63 within the next 3 days.
ARTÍCULOS RELACIONADOS
AMD – breach of a trending resistance line that has been tested at least twice before.
The breakout of AMD through the resistance line of a Ascending Triangle could be a sign of the…
GOOGL keeps moving closer towards 247.2200. Will it finally breach this level?
GOOGL is moving towards a line of 247.2200 which it has tested numerous times in the past. We…
Resistance line breached by BIDU. This price has been tested at least twice before.
BIDU has broken through a resistance line of a Triangle and suggests a possible movement to 141.6768 within…

