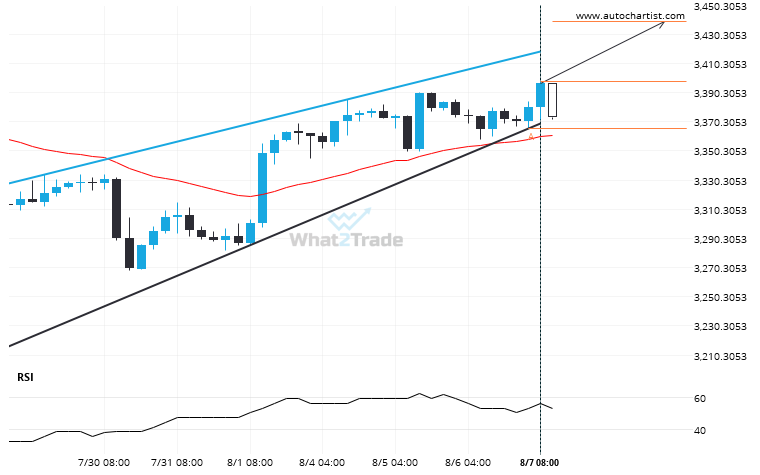
Gold Spot was identified at around 3397.525 having recently rebounded of the support on the 4 hour data interval. Ultimately, the price action of the stock has formed a Rising Wedge pattern. This squeeze may increases the chances of a strong breakout. The projected movement will potentially take the price to around the 3439.1500 level.
ARTÍCULOS RELACIONADOS
Natural Gas likely to test 3.1605 in the near future. Where to next?
The price of Natural Gas in heading back to the resistance area. It is possible that it will…
Because Gold Spot formed a Inverse Head and Shoulders pattern, we expect it to touch the resistance line. If it breaks through resistance it may move much higher
Gold Spot is heading towards the resistance line of a Inverse Head and Shoulders and could reach this…
Important price line being approached by Brent Crude. This price has been tested numerous times before.
Brent Crude is moving towards a key resistance level at 69.6870. Brent Crude has previously tested this level…