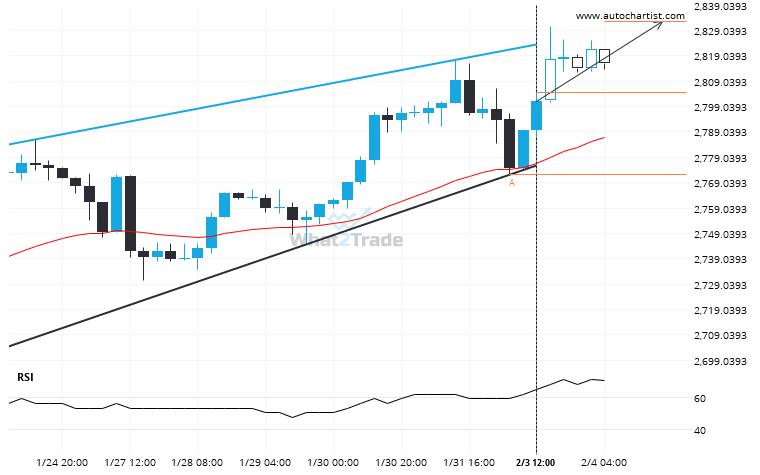
Emerging Rising Wedge pattern in its final wave was identified on the Gold Spot 4 hour chart. After a strong bullish run, we find Gold Spot heading towards the upper triangle line with a possible resistance at 2832.6282. If the resistance shows to hold, the Rising Wedge pattern suggests a rebound back towards current levels.
ARTÍCULOS RELACIONADOS
US Oil is signaling a possible trend reversal on the intraday charts with price not breaching support.
A Channel Down pattern was identified on US Oil at 64.0955, creating an expectation that it may move…
A final push possible on Brent Crude as it starts approaching a price line of 67.1675.
Brent Crude is about to retest a key horizontal support level near 67.1675. It has tested this level…
After testing resistance twice in the past, US Oil has finally broken through. Can we expect a bullish trend to follow?
This trade setup on US Oil is formed by a period of consolidation; a period in which the…

