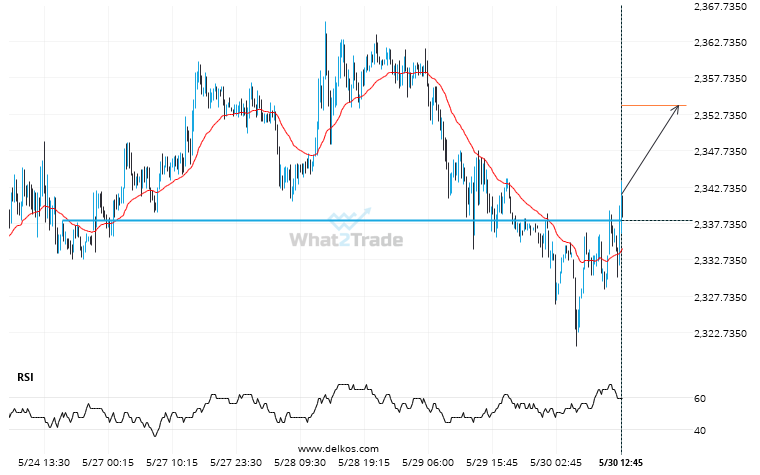
Gold June 2024 has broken through a resistance line. It has touched this line numerous times in the last 6 days. This breakout shows a potential move to 2354.0000 within the next 21 hours. Because we have seen it retrace from this level in the past, one should wait for confirmation of the breakout.
ARTÍCULOS RELACIONADOS
Gold Spot is signaling a possible trend reversal on the intraday charts with price not breaching support.
Gold Spot was identified at around 3397.525 having recently rebounded of the support on the 4 hour data…
Natural Gas likely to test 3.1605 in the near future. Where to next?
The price of Natural Gas in heading back to the resistance area. It is possible that it will…
Because Gold Spot formed a Inverse Head and Shoulders pattern, we expect it to touch the resistance line. If it breaks through resistance it may move much higher
Gold Spot is heading towards the resistance line of a Inverse Head and Shoulders and could reach this…