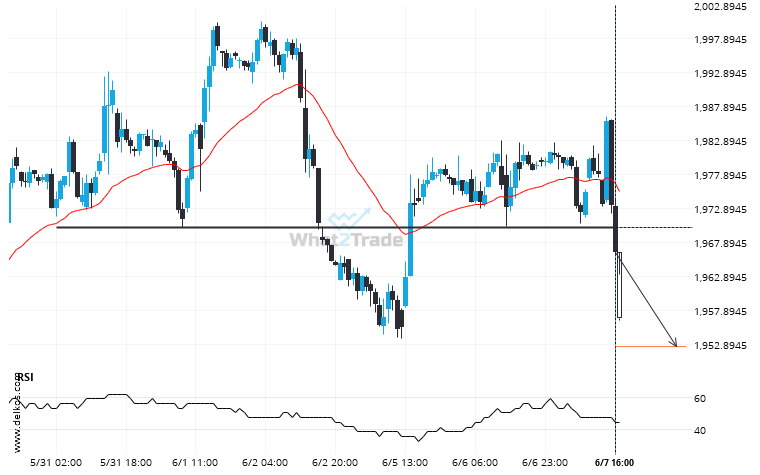
Gold AUGUST 2023 has broken through a support line. It has touched this line numerous times in the last 8 days. This breakout shows a potential move to 1952.6100 within the next 2 days. Because we have seen it retrace from this level in the past, one should wait for confirmation of the breakout.
ARTÍCULOS RELACIONADOS
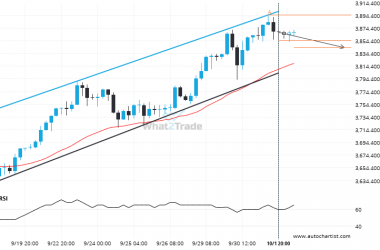
Because Gold Spot formed a Channel Up pattern, we expect it to touch the support line. If it breaks through support it may move much lower
Gold Spot is moving towards a support line. Because we have seen it retrace from this line before,…
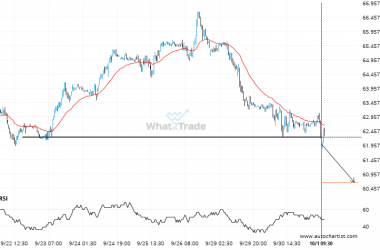
US Oil is currently testing a level of 62.2340. Will the breakout continue or will things reverse?
US Oil has broken through 62.2340 which it has tested numerous times in the past. We have seen…
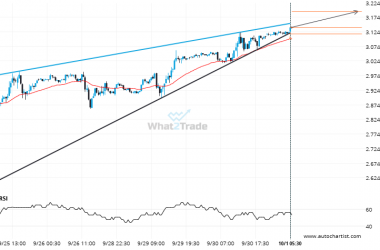
A Rising Wedge has formed, Natural Gas is approaching support. Can we expect a breakout and the start of a new trend or a reversal?
Natural Gas was identified at around 3.1395 having recently rebounded of the support on the 30 Minutes data…

