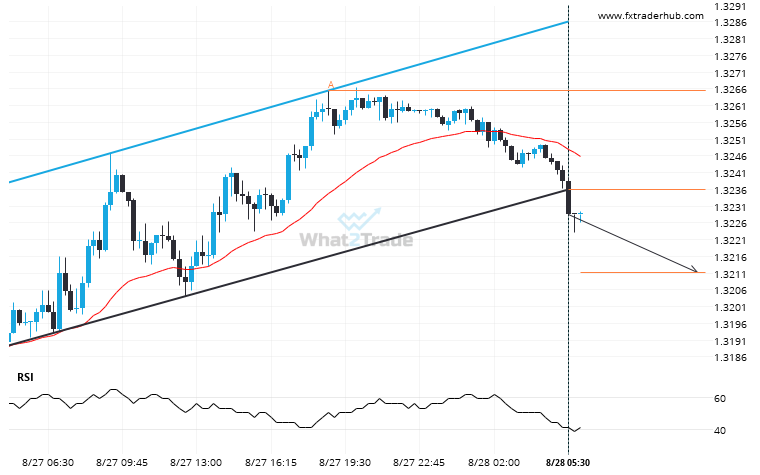
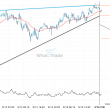
GBP/USD moved through the support line of a Channel Up at 1.3235852173913045 on the 15 Minutes chart. This line has been tested a number of times in the past and this breakout could mean an upcoming change from the current trend. It may continue in its current direction toward 1.3211.
ARTÍCULOS RELACIONADOS
USDCHF has broken through support of a Descending Triangle. It has touched this line at least twice in the last 30 days.
You would be well advised to confirm the breakout that has just occurred – do you believe the…
Will NZDUSD break through the resistance level it tested before?
The price of NZDUSD in heading back to the resistance area. It is possible that it will struggle…
AUDCAD is signaling a possible trend reversal on the intraday charts with price not breaching support.
AUDCAD is heading towards the resistance line of a Channel Down and could reach this point within the…