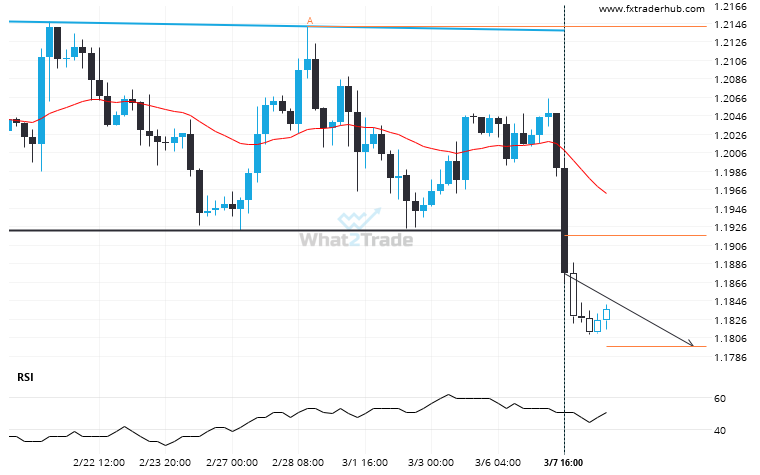
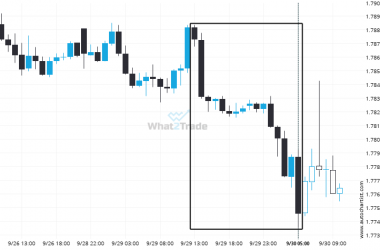
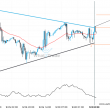
GBP/USD has broken through the support line of a Double Top technical chart pattern. Because we have seen it retrace from this line in the past, one should wait for confirmation of the breakout before taking any action. It has touched this line twice in the last 19 days and suggests a possible target level to be around 1.1797 within the next 3 days.
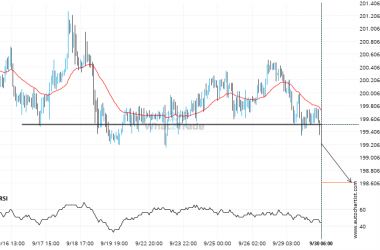
ARTÍCULOS RELACIONADOS
GBPCHF seems to be on its way to support – a possible opportunity?
GBPCHF is moving towards a key support level at 1.0950. GBPCHF has previously tested this level 3 times…
USDCHF has formed 5 bearish candles successively, what is the probability of getting another bearish candle?
Due to the rate of consecutive bearish candles on USDCHF Daily chart we could be in for a…
Important support line being approached by CHFJPY. This price has been tested numerous time in the last 2 days
CHFJPY is moving towards a support line. Because we have seen it retrace from this line before, we…