
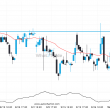
GBP/USD is moving towards a support line. Because we have seen it retrace from this level in the past, we could see either a break through this line, or a rebound back to current levels. It has touched this line numerous times in the last 13 days and may test it again within the next 3 days.
ARTÍCULOS RELACIONADOS
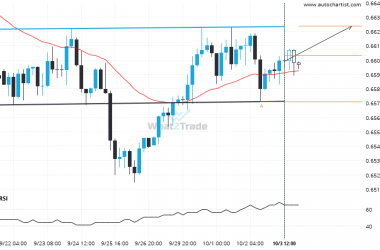
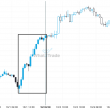
A possible move on AUDUSD as it heads towards resistance
AUDUSD is heading towards the resistance line of a Inverse Head and Shoulders and could reach this point…
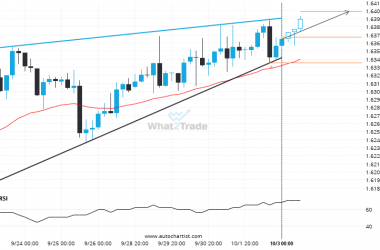
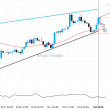
Important resistance line being approached by EURCAD. This price has been tested numerous time in the last 12 days
The movement of EURCAD towards the resistance line of a Rising Wedge is yet another test of the…
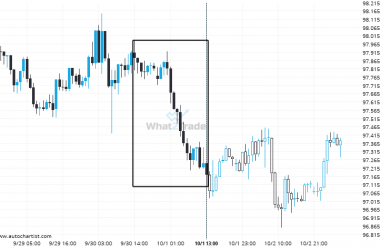
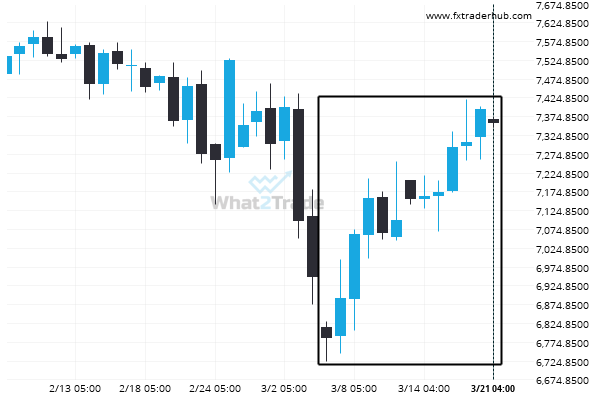
AUDJPY – Large moves like this tend to draw attention.
AUDJPY reached 97.175 after a 0.72% move spanning 23 hours.