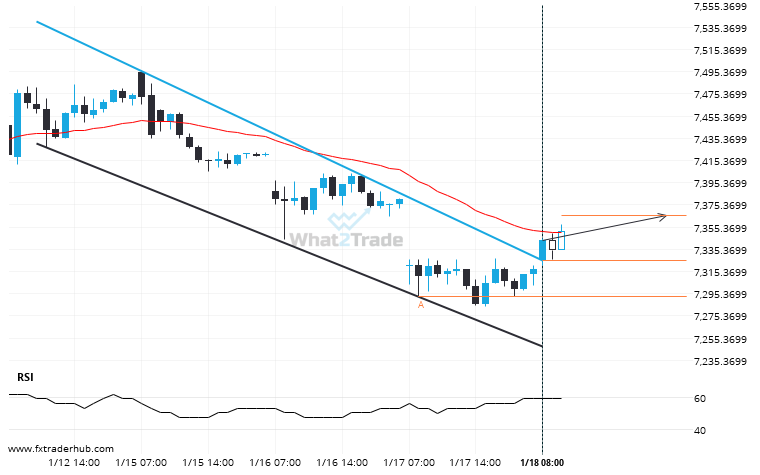
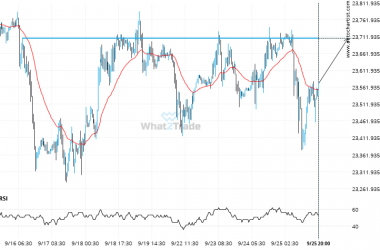
FRA40 moved through the resistance line of a Channel Down at 7325.260869565218 on the 1 hour chart. This line has been tested a number of times in the past and this breakout could mean an upcoming change from the current trend. It may continue in its current direction toward 7366.0620.
ARTÍCULOS RELACIONADOS
Could 4 consecutive daily bullish candles on ASX 200 be a sign of things to come?
For those of you that don’t believe in trends, this may be an opportunity to take advantage of…
If FTSE 100 touches 9009.0596 it may be time to take action.
The price of FTSE 100 in heading back to the resistance area. It is possible that it will…
Because CAC 40 formed a Triangle pattern, we expect it to touch the support line. If it breaks through support it may move much lower
CAC 40 is moving towards a support line. Because we have seen it retrace from this line before,…