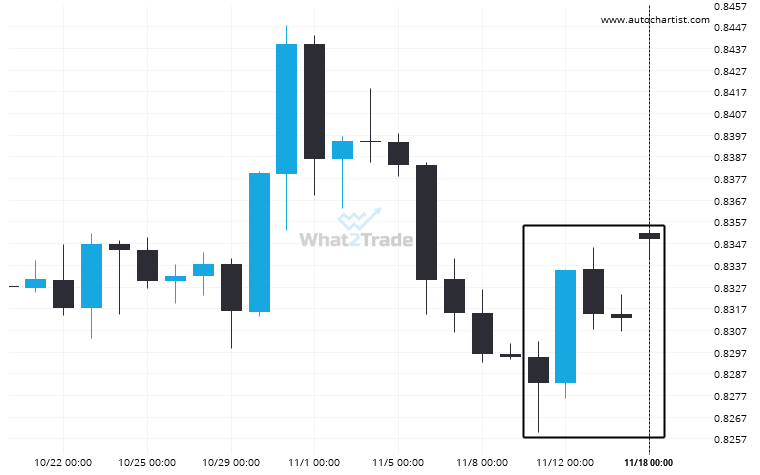
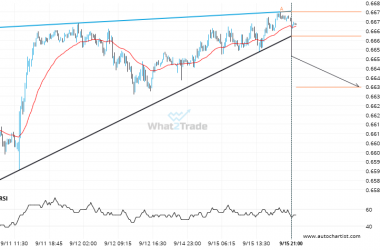
An unexpected large move has occurred on EURGBP Daily chart beginning at 0.82829 and ending at 0.83494. Is this a sign of something new? What can we expect in the future?
ARTÍCULOS RELACIONADOS
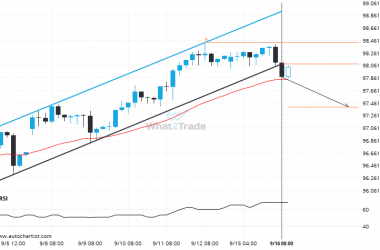
Breach of support could mean a start of a bearish trend on AUDJPY
AUDJPY has broken through a support line of a Channel Up chart pattern. If this breakout holds true,…
USDJPY has broken through a support line. It has touched this line numerous times in the last 7 days.
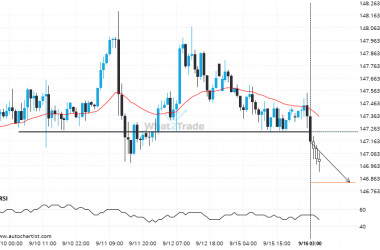
A strong support level has been breached at 147.2330 on the 1 hour USDJPY chart. Technical Analysis theory…
Interesting opportunity on AUDUSD after breaking 0.6661789552238805
This trade setup on AUDUSD is formed by a period of consolidation; a period in which the price…

