
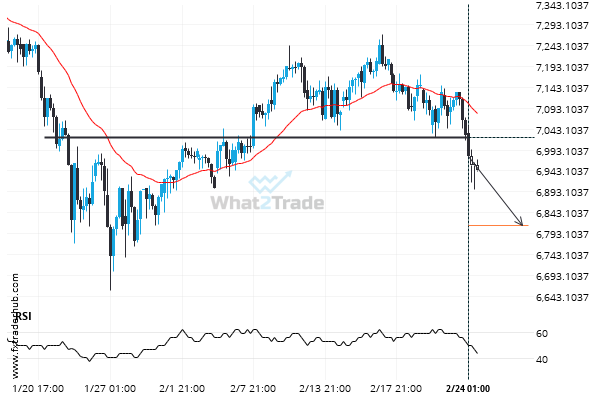
EUR/USD has broken through the support line of a Triangle technical chart pattern. Because we have seen it retrace from this line in the past, one should wait for confirmation of the breakout before taking any action. It has touched this line twice in the last 10 days and suggests a possible target level to be around 1.1201 within the next 3 days.

ARTÍCULOS RELACIONADOS
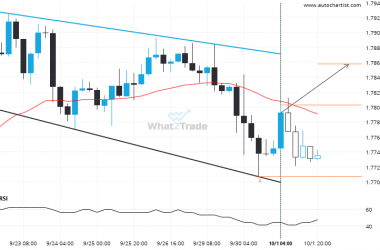
EURAUD is quickly approaching the resistance line of a Channel Down. We expect either a breakout through this line or a rebound.
EURAUD was identified at around 1.780935 having recently rebounded of the support on the 4 hour data interval.…
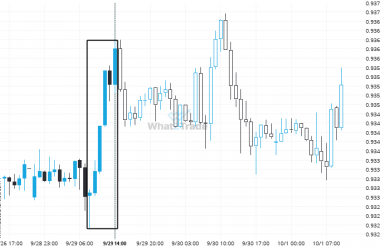
EURCHF reached 0.936355 after a 0.33% move spanning 6 hours.
EURCHF recorded an exceptional 0.33% move over the last 6 hours. Whether you follow trends or look for…
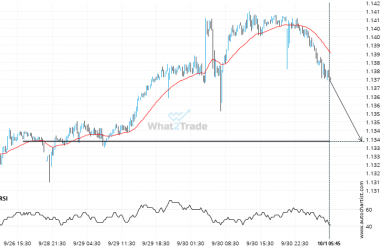
If AUDNZD touches 1.1342 it may be time to take action.
AUDNZD is heading towards a line of 1.1342. If this movement continues, the price of AUDNZD could test…