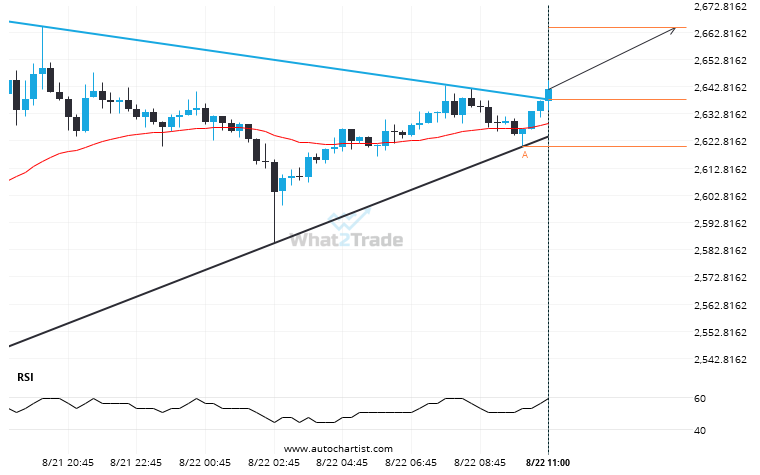
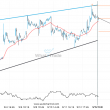
ETHUSD moved through the resistance line of a Triangle at 2637.978 on the 15 Minutes chart. This line has been tested a number of times in the past and this breakout could mean an upcoming change from the current trend. It may continue in its current direction toward 2664.7100.
ARTÍCULOS RELACIONADOS
Could a large bearish move on BTCUSD be a sign of things to come?
Those of you that are trend followers are probably eagerly watching BTCUSD to see if its latest 3.86%…
Breach of 2274.7000 could mean a start of a bearish trend on ETHEUR
The price of ETHEUR in heading in the direction of 2248.1011. Despite the recent breakout through 2274.7000 it…
BTCJPY is signaling a possible trend reversal on the intraday charts with price not breaching resistance.
BTCJPY is moving towards a support line which it has tested numerous times in the past. We have…