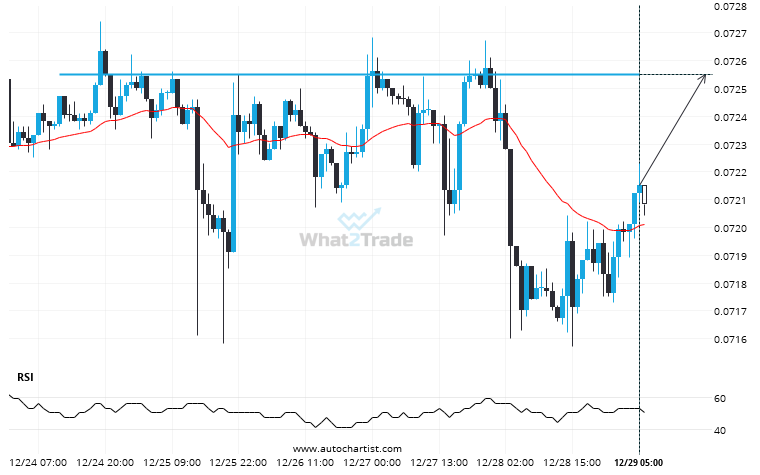
ETHBTC is moving towards a resistance line. Because we have seen it retrace from this level in the past, we could see either a break through this line, or a rebound back to current levels. It has touched this line numerous times in the last 5 days and may test it again within the next 2 days.
ARTÍCULOS RELACIONADOS
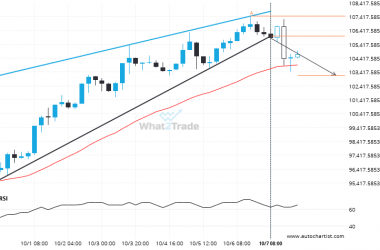
BTCEUR through 106021.44499999998. Is this a confirming a breakout? Will it continue its path in the current trend toward 103177.3167?
Rising Wedge pattern identified on BTCEUR has broken through a support level with the price momentum continuing to…
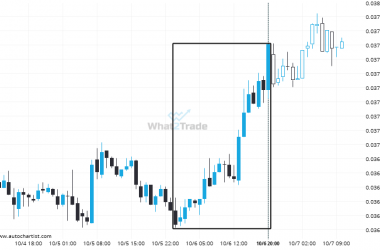
A very large move was recorded on ETHBTC. The size of the shift is exceptional.
ETHBTC has moved higher by 3.48% from 0.03646 to 0.03773 in the last 20 hours.
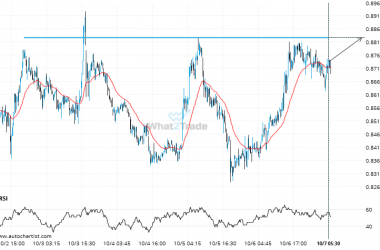
If you’re short ADAUSD you should be aware of the rapidly approaching level of 0.8828
ADAUSD is moving towards a line of 0.8828 which it has tested numerous times in the past. We…

