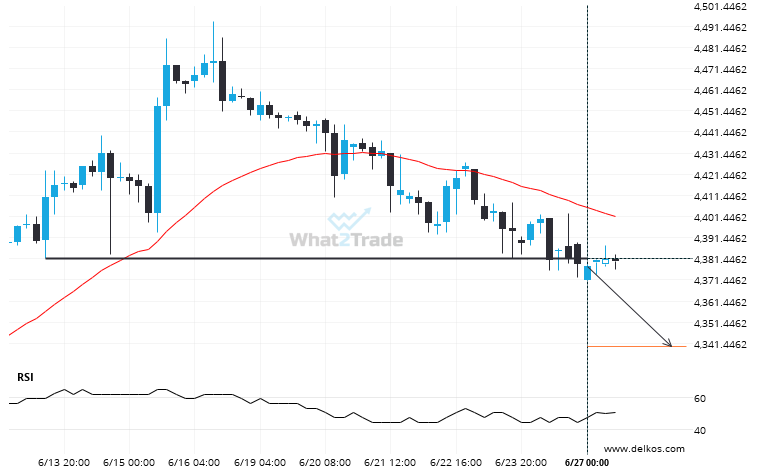
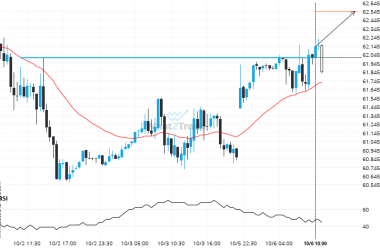
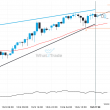
E-mini S&P 500 SEPTEMBER 2023 has broken through a support line. It has touched this line numerous times in the last 14 days. This breakout shows a potential move to 4339.8252 within the next 2 days. Because we have seen it retrace from this level in the past, one should wait for confirmation of the breakout.
ARTÍCULOS RELACIONADOS
US Oil – approaching a support line that has been previously tested at least twice in the past
Emerging Channel Up pattern in its final wave was identified on the US Oil 4 hour chart. After…
Gold Spot is quickly approaching the resistance line of a Channel Up. We expect either a breakout through this line or a rebound.
Gold Spot was identified at around 3328.9805 having recently rebounded of the support on the 1 hour data…
Breach of 63.0270 could mean a start of a bullish trend on US Oil
A strong resistance level has been breached at 63.0270 on the 1 hour US Oil chart. Technical Analysis…