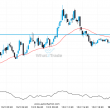
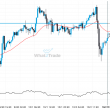
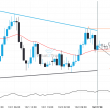
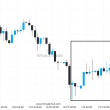
E-Mini S&P 500 March 2024 has broken through the resistance line of a Triangle technical chart pattern. Because we have seen it retrace from this line in the past, one should wait for confirmation of the breakout before taking any action. It has touched this line twice in the last 3 days and suggests a possible target level to be around 4818.8308 within the next 15 hours.
ARTÍCULOS RELACIONADOS
Gold Spot seems to be on its way to resistance – a possible opportunity?
Gold Spot is approaching a resistance line at 3871.7600. If it hits the resistance line, it may break…
Important support line being approached by US Oil. This price has been tested numerous time in the last 8 days
An emerging Falling Wedge has been detected on US Oil on the 30 Minutes chart. There is a…
Because Gold Spot formed a Channel Up pattern, we expect it to touch the support line. If it breaks through support it may move much lower
Gold Spot is moving towards a support line. Because we have seen it retrace from this line before,…

