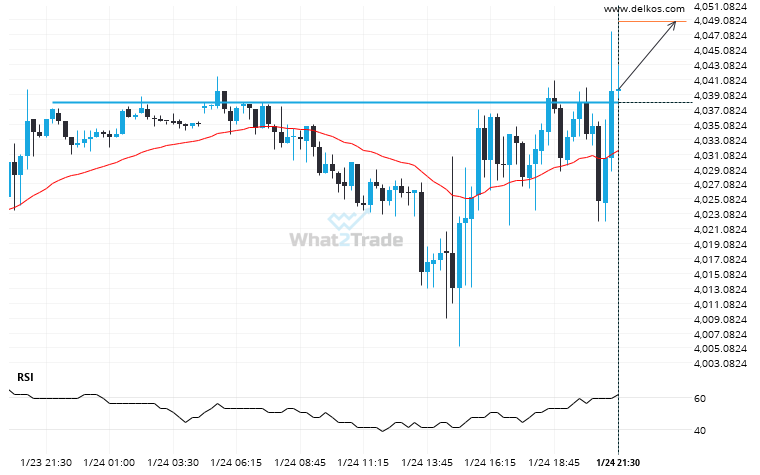
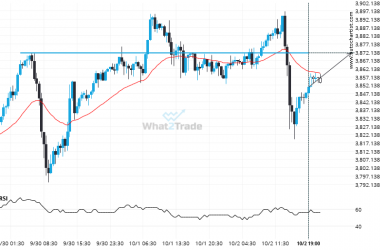
E-mini S&P 500 MARCH 2023 has broken through a resistance line. It has touched this line numerous times in the last 23 hours. This breakout shows a potential move to 4048.8999 within the next 5 hours. Because we have seen it retrace from this level in the past, one should wait for confirmation of the breakout.
ARTÍCULOS RELACIONADOS
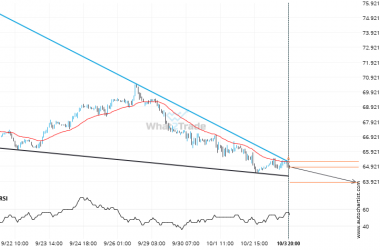
Brent Crude formed a Falling Wedge on the 1 hour chart. Retest of support in sight.
Emerging Falling Wedge detected on Brent Crude – the pattern is an emerging one and has not yet…
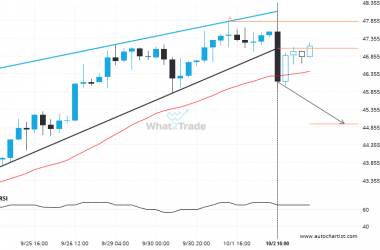
Breach of support could mean a start of a bearish trend on Silver Spot
This trade setup on Silver Spot is formed by a period of consolidation; a period in which the…
Gold Spot seems to be on its way to resistance – a possible opportunity?
Gold Spot is approaching a resistance line at 3871.7600. If it hits the resistance line, it may break…

