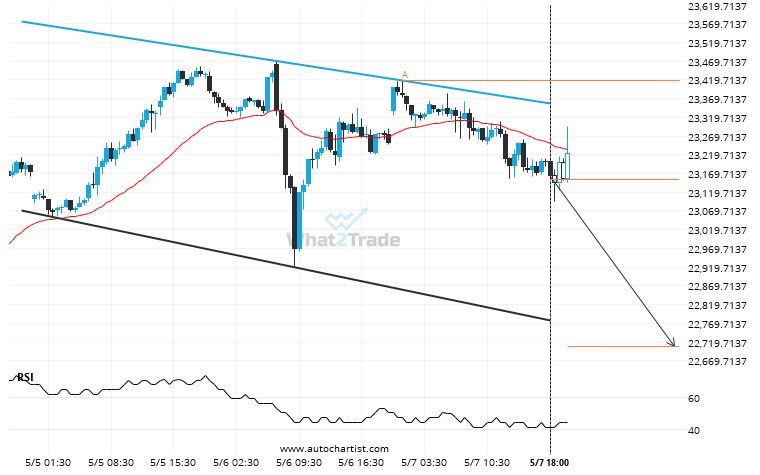
Emerging Channel Down pattern in its final wave was identified on the DAX 40 30 Minutes chart. After a strong bearish run, we find DAX 40 heading towards the upper triangle line with a possible resistance at 22707.1250. If the support shows to hold, the Channel Down pattern suggests a rebound back towards current levels.
ARTÍCULOS RELACIONADOS
NAS 100 is signaling a possible trend reversal on the intraday charts with price not breaching support.
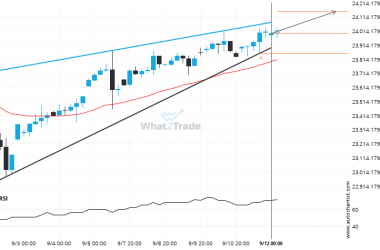
NAS 100 is heading towards the resistance line of a Rising Wedge. If this movement continues, the price…
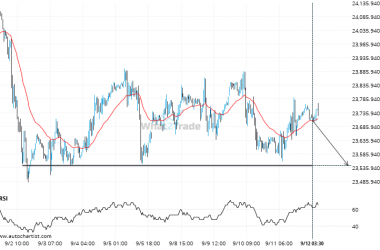
If DAX 40 touches 23544.0000 it may be time to take action.
DAX 40 is en route to a very important line that will be a definite deciding factor of…
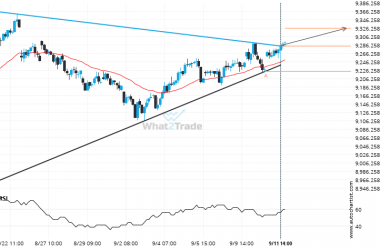
FTSE 100 breakout from a Triangle trade setup. Will it continue this trend to hit the target price?
This trade setup on FTSE 100 is formed by a period of consolidation; a period in which the…

