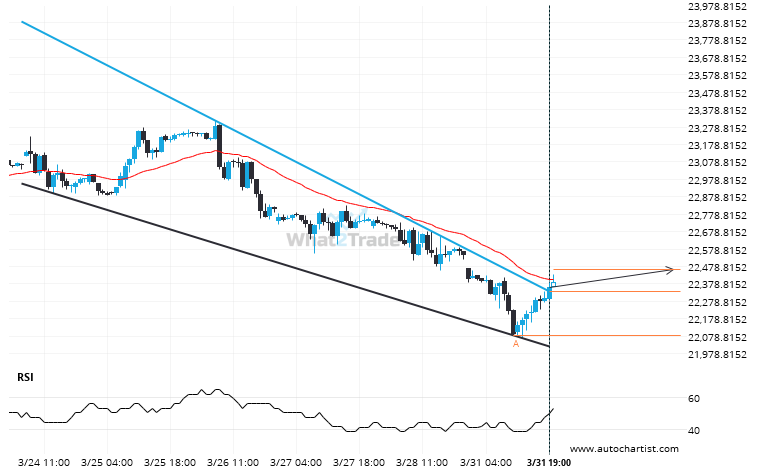
You would be well advised to confirm the breakout that has just occurred – do you believe the move through resistance to be significant? Do you have confirming indicators that the price momentum will continue? If so, look for a target of 22461.1176 but consider reducing the size of your position as the price gets closer to that target.
ARTÍCULOS RELACIONADOS
US 500 has broken through resistance of a Triangle. It has touched this line at least twice in the last 6 days.
US 500 has broken through a resistance line of a Triangle chart pattern. If this breakout holds true,…
DAX 40 – approaching a price line that has been previously tested numerous times in the past
DAX 40 is heading towards 23613.5000 and could reach this point within the next 20 hours. It has…
FTSE 100 is approaching a resistance line of a Rising Wedge. It has touched this line numerous times in the last 9 days.
Emerging Rising Wedge pattern in its final wave was identified on the FTSE 100 1 hour chart. After…