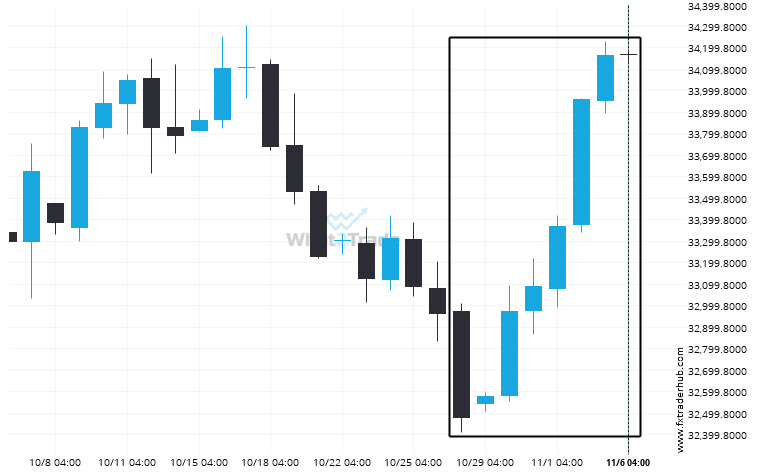
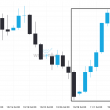
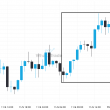
An unexpected large move has occurred on US30 Daily chart beginning at 32475.0 and ending at 34164.0. Is this a sign of something new? What can we expect in the future?
ARTÍCULOS RELACIONADOS
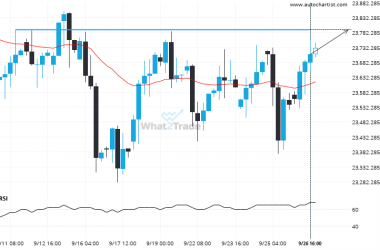
DAX 40 heading towards a price it has tested 4 times in the recent past.
DAX 40 is approaching a resistance line at 23791.3008. If it hits the resistance line, it may break…
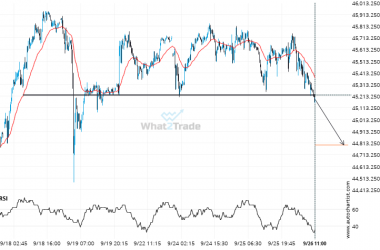
Nikkei 225 may be on a start of a new bearish trend after its breakout through this important support level
Nikkei 225 is once again retesting a key horizontal support level at 45225.0000. It has tested this level…
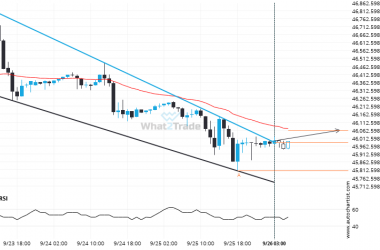
DOW 30 has broken through resistance of a Falling Wedge. It has touched this line at least twice in the last 3 days.
The breakout of DOW 30 through the resistance line of a Falling Wedge could be a sign of…

