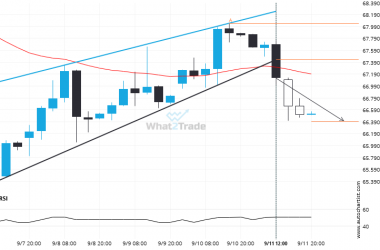
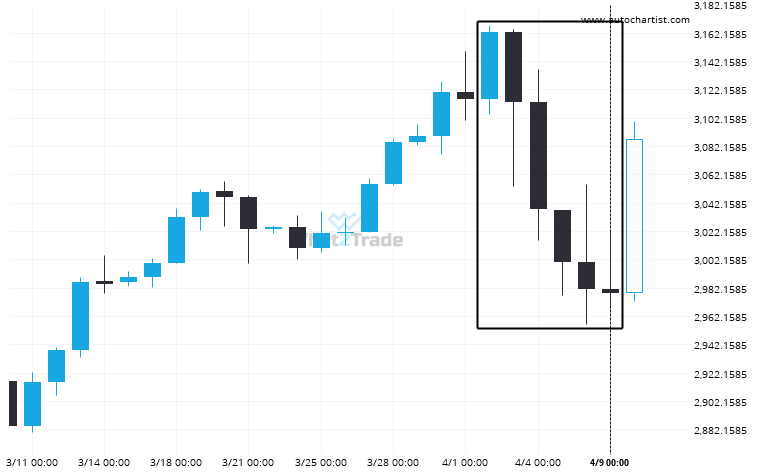
An unexpected large move has occurred on Gold Spot Daily chart beginning at 3162.705 and ending at 2978.535. Is this a sign of something new? What can we expect in the future?
Could a large bearish move on Gold Spot be a sign of things to come?

An unexpected large move has occurred on Gold Spot Daily chart beginning at 3162.705 and ending at 2978.535. Is this a sign of something new? What can we expect in the future?