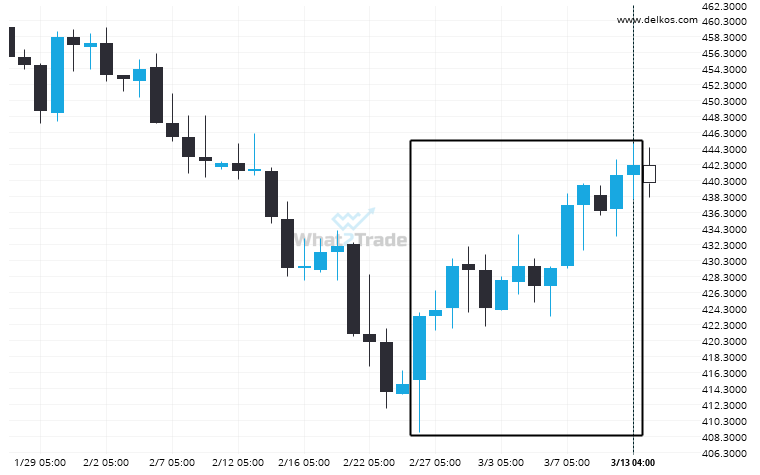
An unexpected large move has occurred on Corn May 2024 Daily chart beginning at 423.25 and ending at 442.25. Is this a sign of something new? What can we expect in the future?
Corn May 2024 moves higher to 442.25 in the last 16 days.

An unexpected large move has occurred on Corn May 2024 Daily chart beginning at 423.25 and ending at 442.25. Is this a sign of something new? What can we expect in the future?