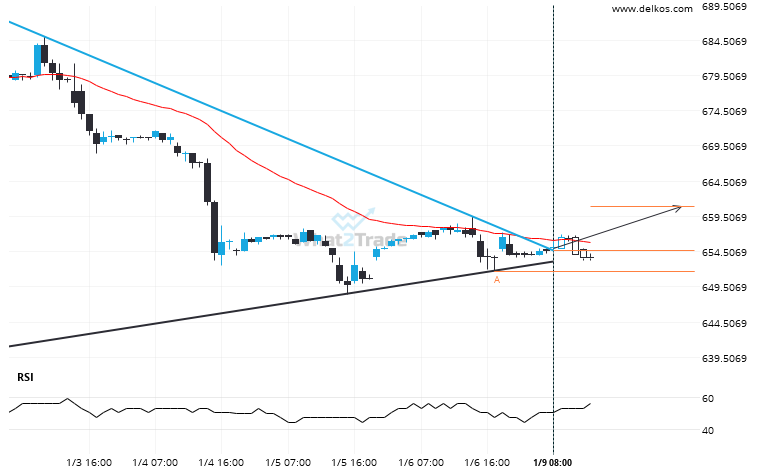
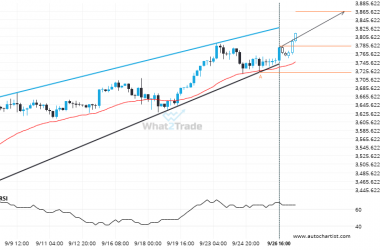
CORN MARCH 2023 has broken through the resistance line of a Triangle technical chart pattern. Because we have seen it retrace from this line in the past, one should wait for confirmation of the breakout before taking any action. It has touched this line twice in the last 11 days and suggests a possible target level to be around 660.8793 within the next 17 hours.
ARTÍCULOS RELACIONADOS
US Oil – Large moves like this tend to draw attention.
An unexpected large move occurred on US Oil 1 hour chart, starting at 65.5195 and reaching 63.2685. It…
Breach of 64.8690 could mean a start of a bearish trend on US Oil
US Oil has broken through 64.8690 which it has tested numerous times in the past. We have seen…
Gold Spot is signaling a possible trend reversal on the intraday charts with price not breaching support.
Gold Spot is trapped in a Rising Wedge formation, implying that a breakout is Imminent. This is a…

