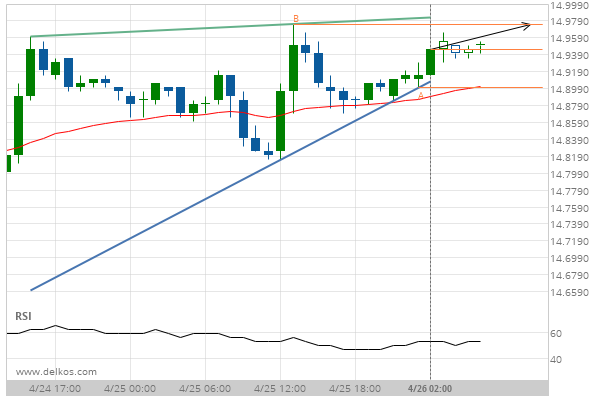
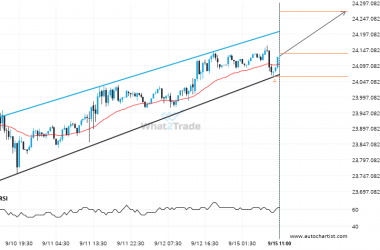
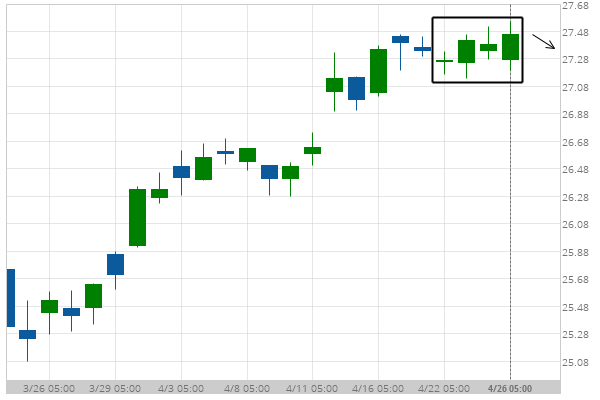
LTCEUR formed a Falling Wedge on the 1 hour chart. Retest of support in sight. CryptobyWhat2tradeAugust 19, 2025 6:15 am1 minute read
Rare bullish streak on the ASX 200 Daily chart. Global IndicesbyWhat2tradeAugust 19, 2025 6:14 am1 minute read
A Triangle has formed, US Oil is approaching resistance. Can we expect a breakout and the start of a new trend or a reversal? FuturesbyWhat2tradeAugust 19, 2025 6:14 am1 minute read
1 min Global Indices Rare bullish streak on the ASX 200 Daily chart. ASX 200 posted a high rate of consecutive bullish candles on the Daily chart. What2tradeAugust 19, 2025 6:14 am Read More
1 min Global Indices After testing 7892.2002 numerous times, CAC 40 has finally broken through. Can we expect a bullish trend to follow? CAC 40 has broken through 7892.2002 which it has tested numerous times in the past. We have seen… What2tradeAugust 18, 2025 10:16 pm Read More
1 min Global Indices US 500 through 6451.963030303029. Is this a confirming a breakout? Will it continue its path in the current trend toward 6406.5663? This trade setup on US 500 is formed by a period of consolidation; a period in which the… What2tradeAugust 18, 2025 11:17 am Read More