
Browsing Category
US Stocks
6617 posts
TSLA hits 248.8500 after a run of 5 consecutive daily candles spanning 6 days.
After posting 5 consecutive bearish candles in 6 days, you may start considering where TSLA is heading next,…
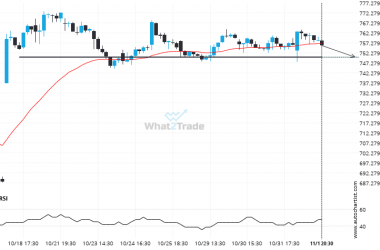
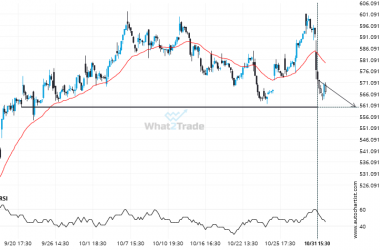
Will NFLX break through the support level it tested before?
NFLX is about to retest a key horizontal support level near 749.9600. It has tested this level 5…
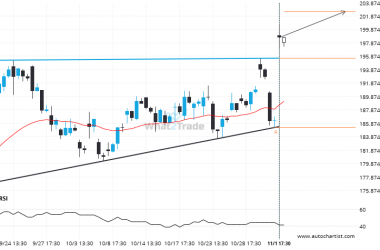
Breach of resistance could mean a start of a bullish trend on AMZN
AMZN has broken through a resistance line of a Ascending Triangle chart pattern. If this breakout holds true,…
Could a large bearish move on AAPL be a sign of things to come?
Those of you that are trend followers are probably eagerly watching AAPL to see if its latest 4.89%…
MRNA is signaling a possible trend reversal on the intraday charts with price not breaching resistance.
MRNA is approaching the support line of a Channel Down. It has touched this line numerous times in…
META likely to test 560.2200 in the near future. Where to next?
A strong support level has been identified at 560.2200 on the 1 hour META chart. META is likely…
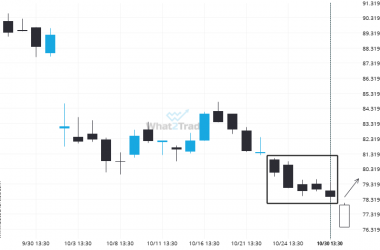
NKE experienced 5 consecutive daily bearish candles to reach a price of 78.4300
NKE has moved lower after 5 consecutive daily candles from 80.9100 to 78.4300 in the last 8 days.
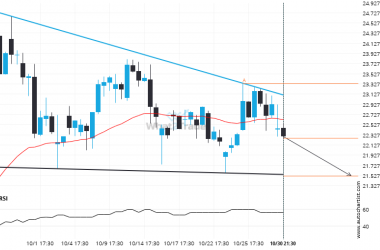
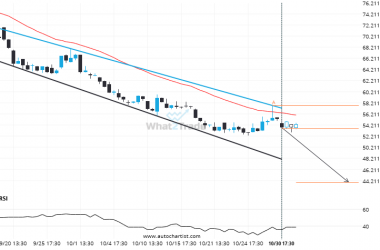
INTC is approaching a support line of a Descending Triangle. It has touched this line numerous times in the last 52 days.
INTC is trapped in a Descending Triangle formation, implying that a breakout is Imminent. This is a great…
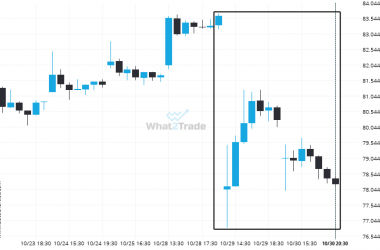
An unexpected large move has occurred on PYPL 1 hour chart! Is this a sign of something new? What can we expect?
An unexpected large move has occurred on PYPL 1 hour chart beginning at 83.62 and ending at 78.2.…
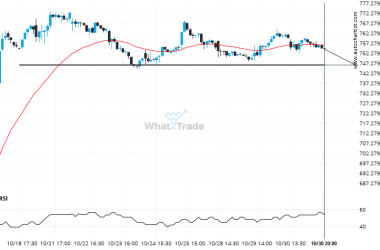
If you’re long NFLX you should be aware of the rapidly approaching level of 746.2500
The price of NFLX in heading back to the support area. It is possible that it will struggle…