
Browsing Category
US Stocks
6613 posts
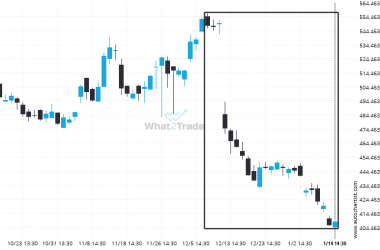
Could a large bearish move on ADBE be a sign of things to come?
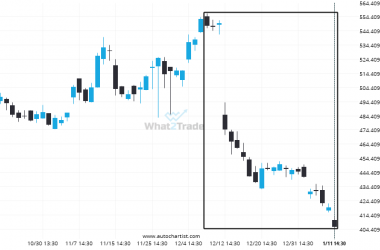
An unexpected large move has occurred on ADBE Daily chart beginning at 547.91 and ending at 408.5. Is…
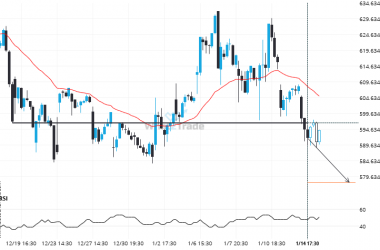
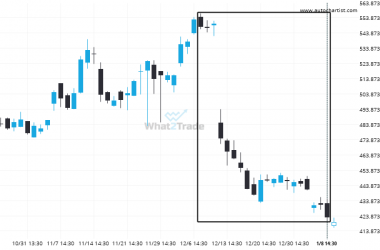
After testing 596.7200 numerous times, META has finally broken through. Can we expect a bearish trend to follow?
META has broken through 596.7200 which it has tested numerous times in the past. We have seen it…
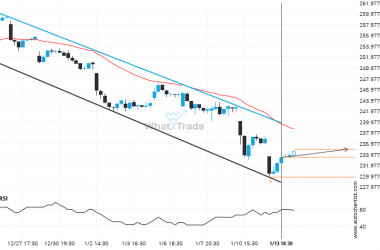
Important resistance line being approached by AAPL. This price has been tested numerous time in the last 25 days
AAPL is moving towards a resistance line. Because we have seen it retrace from this line before, we…
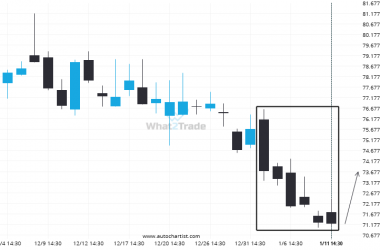
ADBE moves lower to 405.76 in the last 34 days.
Those of you that are trend followers are probably eagerly watching ADBE to see if its latest 25.94%…
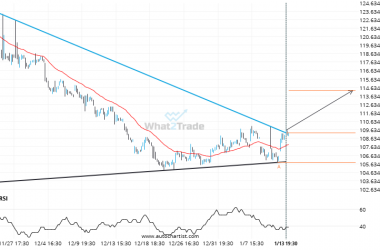
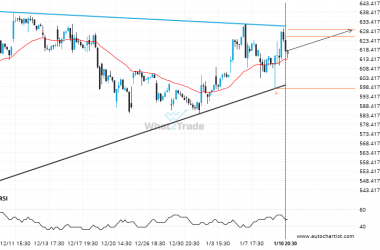
After testing resistance twice in the past, XOM has finally broken through. Can we expect a bullish trend to follow?
XOM has broken through a resistance line. It has touched this line at least twice in the last…
Rare set of bearish consecutive candles on the NKE Daily chart. Can we expect a turn-around?
Trend followers are probably eagerly watching NKE to see if its latest 6 consecutive candles continues. If not,…
AAPL – It’s perhaps in these huge moves where the greatest opportunity lies
An unexpected large move has occurred on AAPL Daily chart beginning at 259.15 and ending at 236.76. Is…
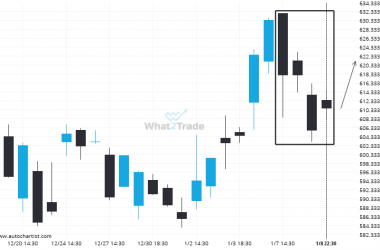
Important resistance line being approached by META. This price has been tested numerous time in the last 51 days
META was identified at around 625.27 having recently rebounded of the support on the 1 hour data interval.…
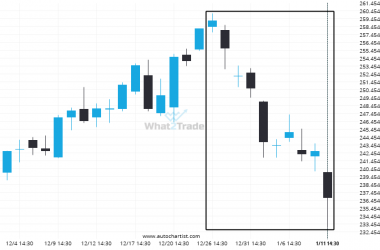
Is the extremely large movement on ADBE a sign of things to come?
ADBE hits 422.61 after a 22.87% move spanning 31 days.
Is the META poised for a turn-around after 4 consecutive bearish 4 hour candles?
Due to the rate of consecutive bearish candles on META 4 hour chart we could be in for…