
Browsing Category
US Stocks
6612 posts
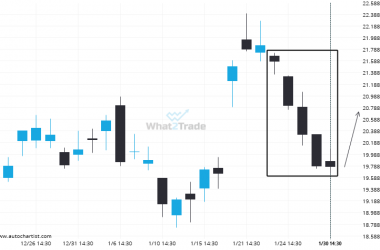
MSFT has formed 6 bearish candles successively, what is the probability of getting another bearish candle?
After posting 6 consecutive bearish candles in 3 days, you may start considering where MSFT is heading next,…
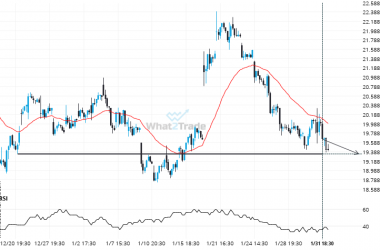
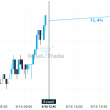
If you’re long INTC you should be aware of the rapidly approaching level of 19.3400
INTC is en route to a very important line that will be a definite deciding factor of what…
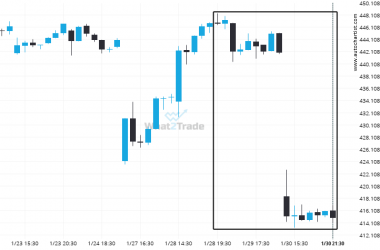
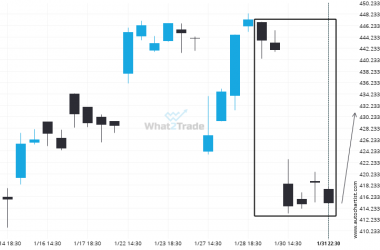
Could a large bearish move on MSFT be a sign of things to come?
An unexpected large move has occurred on MSFT 1 hour chart beginning at 446.63 and ending at 414.82.…

CVX seems to be on its way to support – a possible opportunity?
CVX is heading towards a line of 155.2000. If this movement continues, the price of CVX could test…
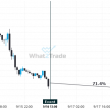
INTC experienced 5 consecutive daily bearish candles to reach a price of 19.7700
Trend followers are probably eagerly watching INTC to see if its latest 5 consecutive candles continues. If not,…
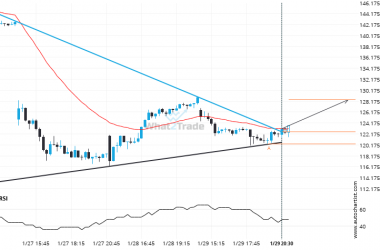
NVDA has broken out from the Triangle pattern. Expect it to hit 128.3957 soon.
NVDA moved through the resistance line of a Triangle at 122.60230769230768 on the 15 Minutes chart. This line…

A final push possible on TSLA as it starts approaching a price line of 384.3300.
TSLA is about to retest a key horizontal support level near 384.3300. It has tested this level 3…
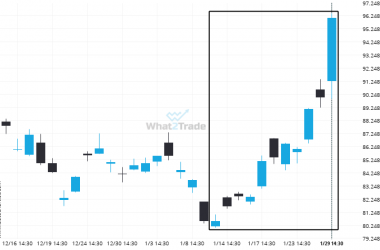
BABA moves higher to 96.07 in the last 17 days.
BABA has moved higher by 19.27% from 80.55 to 96.07 in the last 17 days.
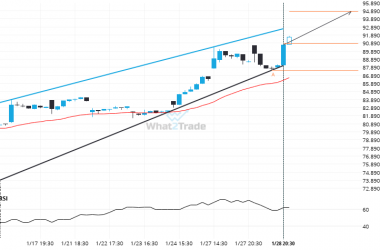
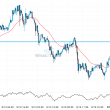
After testing the resistance line numerous times, BIDU is once again approaching this line. Can we expect a bullish trend to follow?
BIDU is moving towards a resistance line which it has tested numerous times in the past. We have…
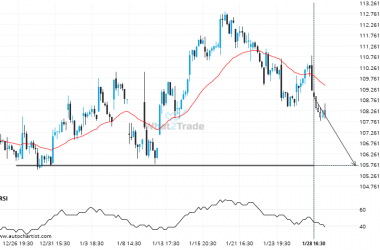
A final push possible on XOM as it starts approaching a price line of 105.7200.
The movement of XOM towards 105.7200 price line is yet another test of the line it reached numerous…