


Browsing Category
US Stocks
6657 posts
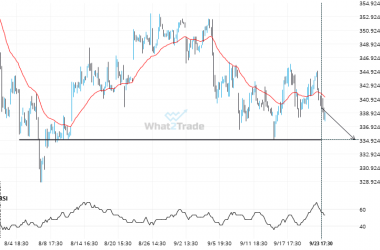
After testing 334.9800 numerous times, V is once again approaching this price point. Can we expect a bearish trend to follow?
The movement of V towards 334.9800 price line is yet another test of the line it reached numerous…
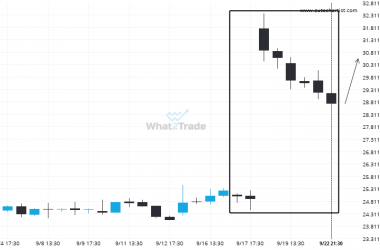
Large bullish move on INTC.
INTC posted a high rate of consecutive bullish candles on the 4 hour chart.
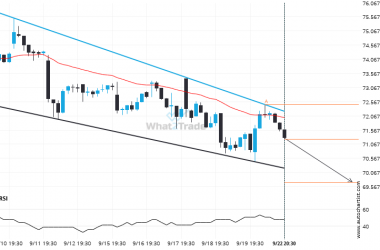
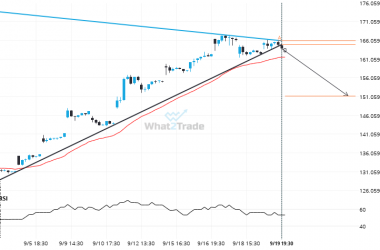
Important support line being approached by NKE. This price has been tested numerous time in the last 20 days
NKE is approaching the support line of a Falling Wedge. It has touched this line numerous times in…
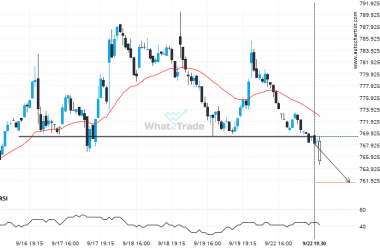
It’s time to make a decision on META – its recent breach of 769.2950 could be a sign of a new trend to follow.
The price of META in heading in the direction of 761.5640. Despite the recent breakout through 769.2950 it…
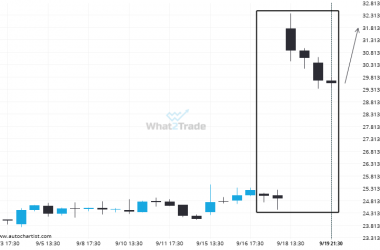
INTC has shown consistent movement in one direction.
INTC moved higher from 25.0750 to 29.5500 after 6 consecutive 4 hour candles over 3 days.
Breach of support could mean a start of a bearish trend on BABA
The last 18 1 hour candles on BABA formed a Triangle pattern and broken out through the pattern…
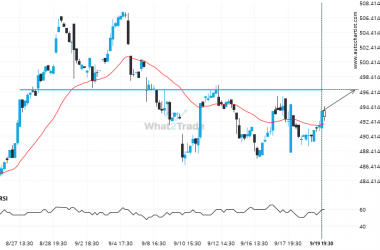
BRK.B likely to test 496.6600 in the near future. Where to next?
BRK.B is about to retest a key horizontal resistance level near 496.6600. It has tested this level 4…
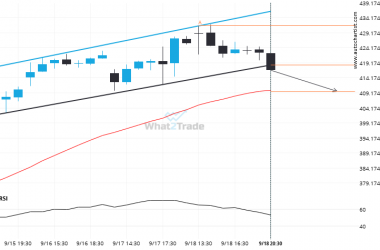
Interesting opportunity on TSLA after breaking 418.4015384615385
Flag pattern identified on TSLA has broken through a support level with the price momentum continuing to move…
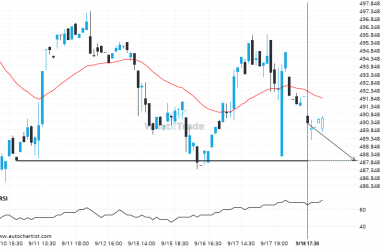
Will BRK.B break through the support level it tested before?
BRK.B is heading towards 487.9200 and could reach this point within the next 7 hours. It has tested…
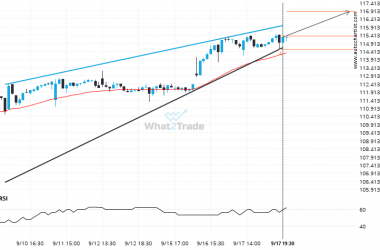
A possible move on XOM as it heads towards resistance
XOM is heading towards the resistance line of a Rising Wedge and could reach this point within the…