
Browsing Category
US Stocks
6607 posts
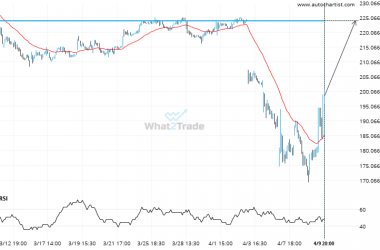
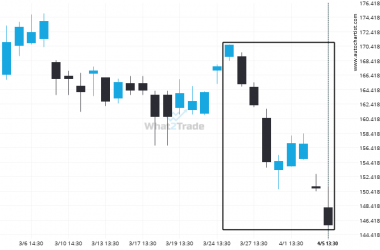
BABA – It’s perhaps in these huge moves where the greatest opportunity lies
A movement of 28.24% over 23 days on BABA doesn’t go unnoticed. You may start considering where it’s…
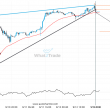
Supports and resistances are primary concepts of technical analysis. AAPL is heading for an important price of 223.9350 – read about what this could mean for the future.
AAPL is approaching a resistance line at 223.9350. If it hits the resistance line, it may break through…
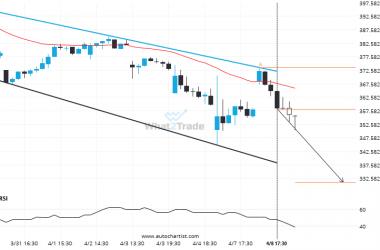
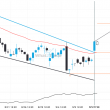
MSFT formed a Channel Down on the 1 hour chart. Retest of support in sight.
MSFT is approaching the support line of a Channel Down. It has touched this line numerous times in…
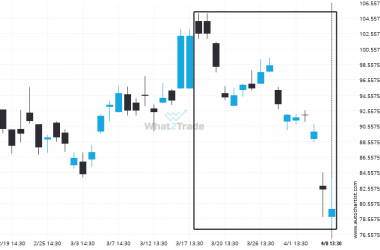
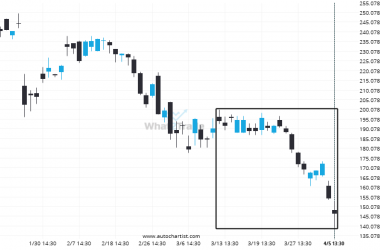
After experiencing a 22.18% bearish move in the space of 22 days, nobody knows where BIDU is headed.
For those of you that don’t believe in trends, this may be an opportunity to take advantage of…
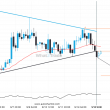
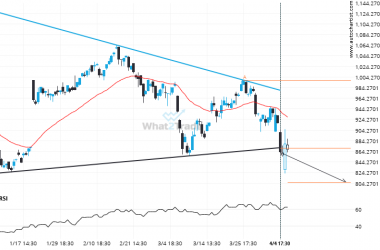
Important support line being approached by TSLA. This price has been tested numerous time in the last 13 days
An emerging Falling Wedge has been detected on TSLA on the 1 hour chart. There is a possible…
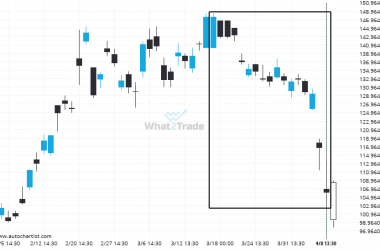
Is the extremely large movement on GOOGL a sign of things to come?
An unexpected large move has occurred on GOOGL Daily chart beginning at 170.54 and ending at 145.65. Is…
NFLX has broken through support of a Triangle. It has touched this line at least twice in the last 102 days.
Triangle pattern identified on NFLX has broken through a support level with the price momentum continuing to move…
Extreme movement experienced on AVGO. Check this chart to see what to do next
A movement of 24.63% over 25 days on AVGO doesn’t go unnoticed. You may start considering where it’s…
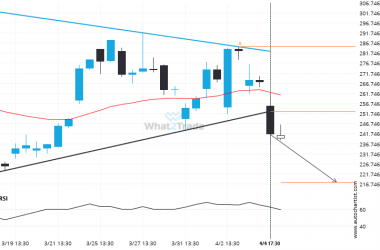
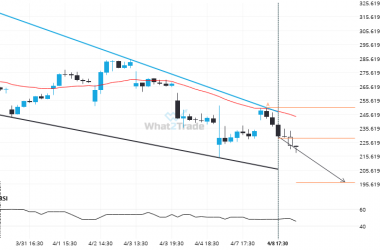
Support line breached by TSLA. This price has been tested at least twice before.
TSLA has broken through a support line of a Triangle chart pattern. If this breakout holds true, we…
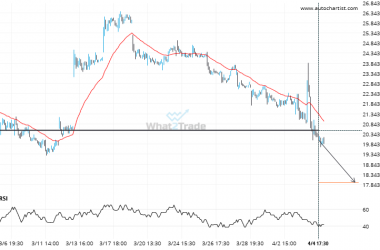
INTC – breach of price line that’s been previously tested numerous times before
INTC has broken through a line of 20.5200. If this breakout holds true, we could see the price…