


Browsing Category
US Stocks
6606 posts
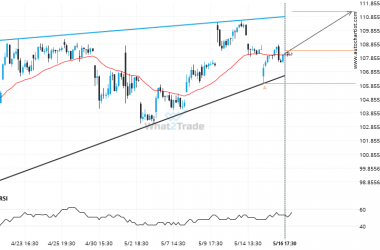
XOM – approaching a resistance line that has been previously tested at least twice in the past
A Rising Wedge pattern was identified on XOM at 108.365, creating an expectation that it may move to…
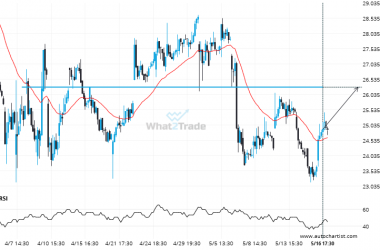
If MRNA touches 26.2700 it may be time to take action.
MRNA is heading towards a line of 26.2700. If this movement continues, the price of MRNA could test…
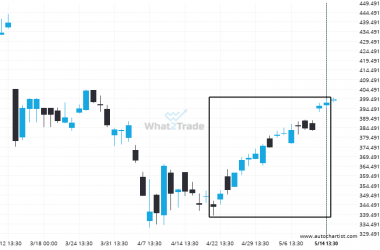
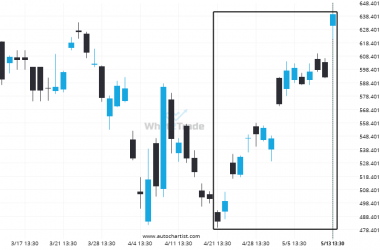
Is the extremely large movement on ADBE a sign of things to come?
ADBE has experienced an extremely big movement in last 23 days. It may continue the trend, but this…
NFLX formed a Channel Up on the 1 hour chart. Retest of resistance in sight.
An emerging Channel Up has been detected on NFLX on the 1 hour chart. There is a possible…
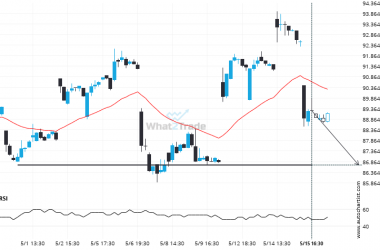
BIDU keeps moving closer towards 86.7100. Will it finally breach this level?
BIDU is heading towards a line of 86.7100. If this movement continues, the price of BIDU could test…
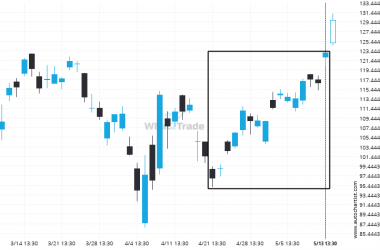
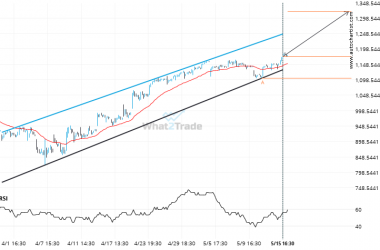
After experiencing a 27.09% bullish move in the space of 23 days, nobody knows where NVDA is headed.
NVDA rose sharply for 22 days – which is an excessively big movement for this instrument; exceeding the…
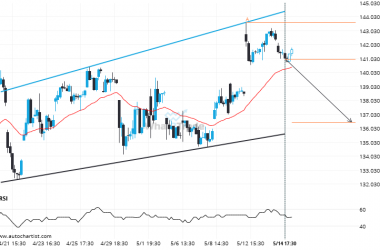
CVX formed a Channel Up on the 1 hour chart. Retest of support in sight.
CVX is heading towards the support line of a Channel Up. If this movement continues, the price of…
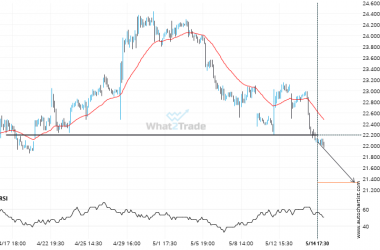
PFE – breach of price line that’s been previously tested numerous times before
A strong support level has been breached at 22.2000 on the 30 Minutes PFE chart. Technical Analysis theory…
META – It’s perhaps in these huge moves where the greatest opportunity lies
For those of you that don’t believe in trends, this may be an opportunity to take advantage of…
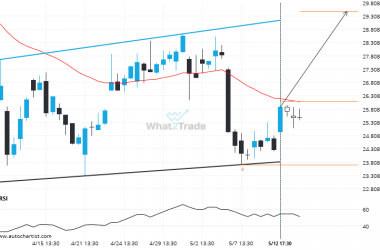
MRNA formed a Channel Up on the 4 hour chart. Retest of resistance in sight.
Emerging Channel Up detected on MRNA – the pattern is an emerging one and has not yet broken…