


Browsing Category
US Stocks
6657 posts
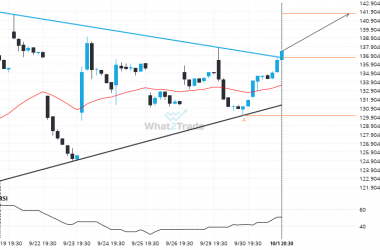
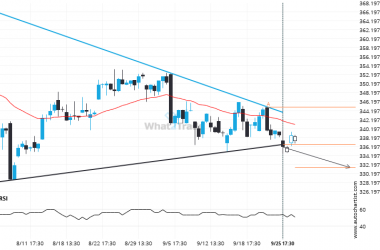
Resistance line breached by BIDU. This price has been tested at least twice before.
BIDU has broken through a resistance line of a Triangle and suggests a possible movement to 141.6768 within…
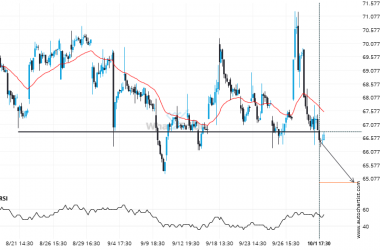
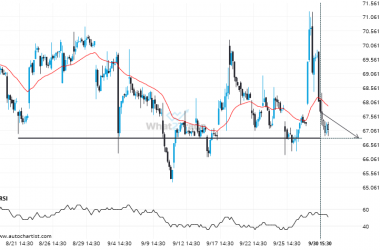
If you’re long PYPL you should be aware that 66.7950 has just been breached – a level tested 6 time in the past
PYPL has broken through a support line. Because we have seen it retrace from this price in the…
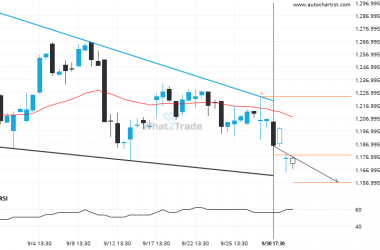
NFLX – approaching a support line that has been previously tested at least twice in the past
A Falling Wedge pattern was identified on NFLX at 1178.335, creating an expectation that it may move to…
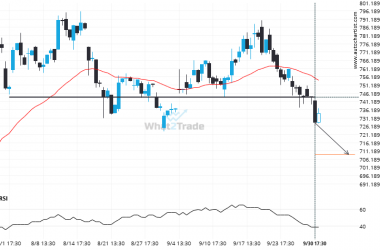
After testing 743.9550 numerous times, META has finally broken through. Can we expect a bearish trend to follow?
META has breached the support line at 743.9550. It may continue the bearish trend towards 708.9245, or, it…
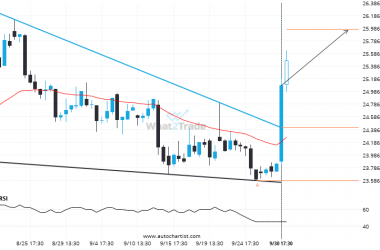
Interesting opportunity on PFE after breaking 24.416999999999994
This trade setup on PFE is formed by a period of consolidation; a period in which the price…
PYPL keeps moving closer towards 66.7950. Will it finally breach this level?
The price of PYPL in heading back to the support area. It is possible that it will struggle…
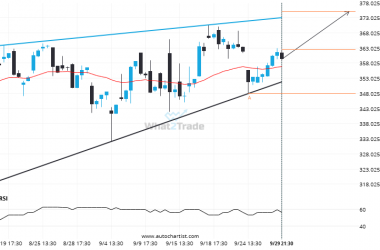
ADBE is approaching a resistance line of a Rising Wedge. It has touched this line numerous times in the last 49 days.
The movement of ADBE towards the resistance line of a Rising Wedge is yet another test of the…
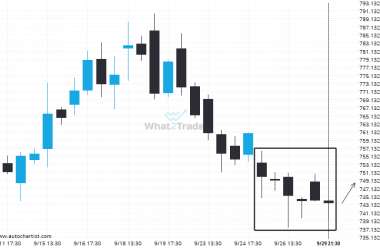
META recorded 6 consecutive 4 hour bearish candles reaching 743.4800.
META experienced an unusual number of bearish candles on the 4 hour timeframe.
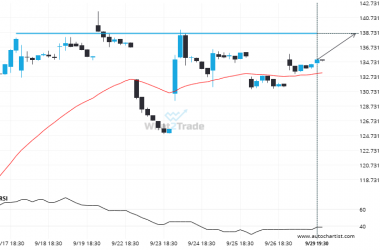
Important price line being approached by BIDU. This price has been tested numerous times before.
BIDU is approaching a resistance line at 138.5250. If it hits the resistance line, it may break through…
Support line breached by V. This price has been tested at least twice before.
You would be well advised to confirm the breakout that has just occurred – do you believe the…