


Browsing Category
US Stocks
6606 posts
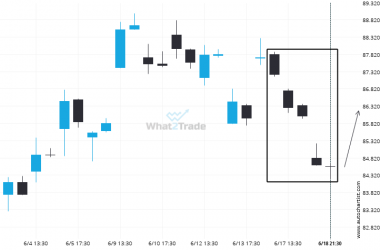
BIDU has formed 5 bearish candles successively, what is the probability of getting another bearish candle?
BIDU has experienced an unusual quantity of bearish candles on the 4 hour timeframe. This is in the…
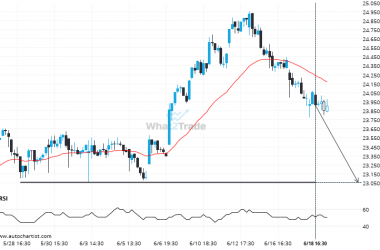
PFE is quickly approaching a very important level it has previously tested numerous times in the past
PFE is moving towards a key support level at 23.0550. PFE has previously tested this level 4 times…
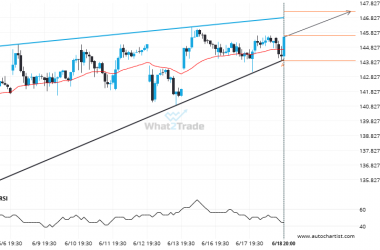
A Rising Wedge has formed, NVDA is approaching support. Can we expect a breakout and the start of a new trend or a reversal?
A Rising Wedge pattern was identified on NVDA at 145.61, creating an expectation that it may move to…
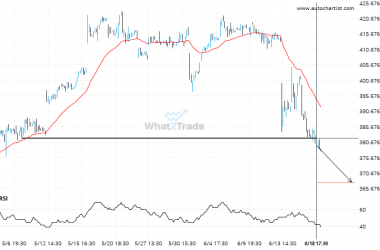
ADBE – breach of price line that’s been previously tested numerous times before
ADBE has broken through a support line. It has touched this line numerous times in the last 43…
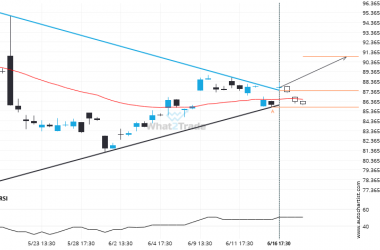
BIDU broke through a resistance at 2025-06-16T15:30:00.000Z, with the price momentum continuing to move in an upward direction over the next hours, good opportunity presents itself with the price expected to reach 90.8876.
BIDU has broken through a resistance line of a Triangle chart pattern. If this breakout holds true, we…
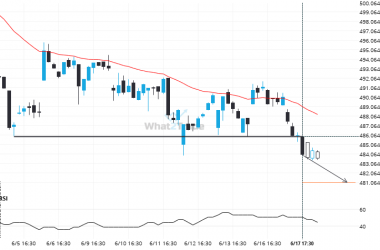
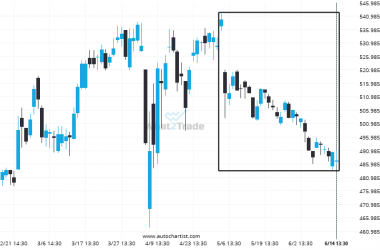
Important price line breached by BRK.B. This price has been tested numerous times before.
BRK.B has breached the support line at 485.9000. It may continue the bearish trend towards 481.0305, or, it…
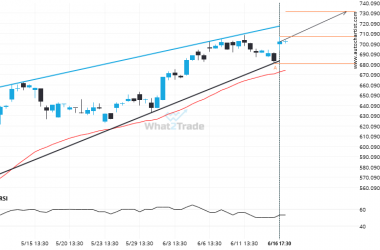
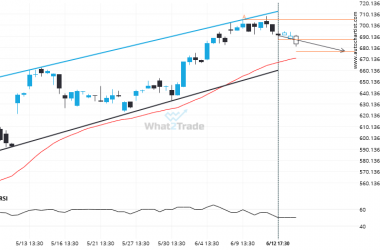
META is signaling a possible trend reversal on the intraday charts with price not breaching support.
A Rising Wedge pattern was identified on META at 707.13, creating an expectation that it may move to…
PYPL keeps moving closer towards 68.5800. Will it finally breach this level?
A strong support level has been identified at 68.5800 on the 4 hour PYPL chart. PYPL is likely…
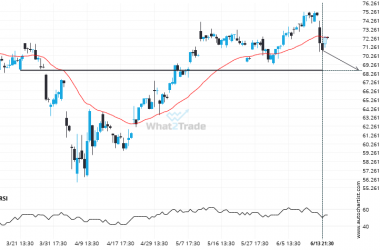
An unexpected large move has occurred on BRK.B Daily chart! Is this a sign of something new? What can we expect?
For those of you that don’t believe in trends, this may be an opportunity to take advantage of…
Important support line being approached by META. This price has been tested numerous time in the last 42 days
META is moving towards a support line. Because we have seen it retrace from this line before, we…