


Browsing Category
US Stocks
6606 posts
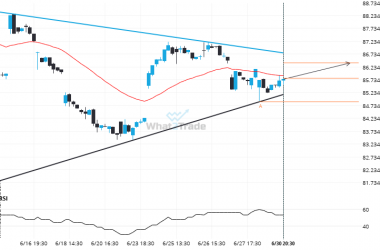
BIDU is approaching a resistance line of a Triangle. It has touched this line numerous times in the last 18 days.
BIDU is moving towards a resistance line. Because we have seen it retrace from this line before, we…
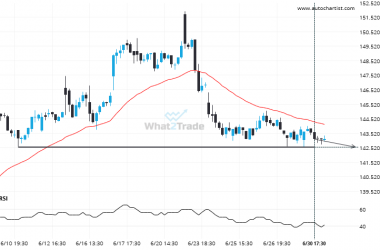
Important price line being approached by CVX. This price has been tested numerous times before.
CVX is heading towards 142.5600 and could reach this point within the next 18 hours. It has tested…
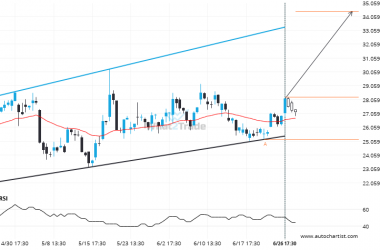
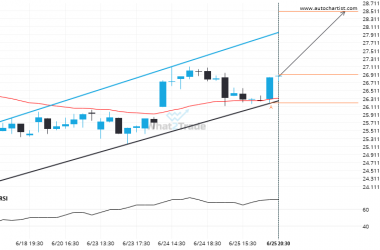
After testing the resistance line numerous times, MRNA is once again approaching this line. Can we expect a bullish trend to follow?
MRNA was identified at around 28.25 having recently rebounded of the support on the 4 hour data interval.…
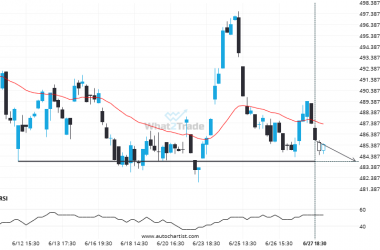
BRK.B heading towards a price it has tested 4 times in the recent past.
A strong support level has been identified at 483.8650 on the 1 hour BRK.B chart. BRK.B is likely…
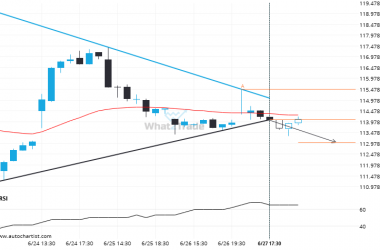
After testing support twice in the past, BABA has finally broken through. Can we expect a bearish trend to follow?
BABA has broken through the support line of a Triangle technical chart pattern. Because we have seen it…
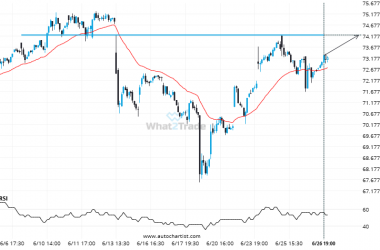
PYPL likely to test 74.2050 in the near future. Where to next?
PYPL is moving towards a key resistance level at 74.2050. This is a previously tested level for PYPL.…
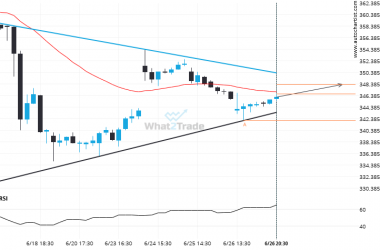
Important resistance line being approached by V. This price has been tested numerous time in the last 11 days
Emerging Triangle detected on V – the pattern is an emerging one and has not yet broken through…
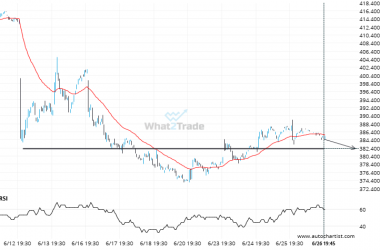
ADBE seems to be on its way to support – a possible opportunity?
The price of ADBE in heading back to the support area. It is possible that it will struggle…
A Channel Up has formed, MRNA is approaching support. Can we expect a breakout and the start of a new trend or a reversal?
MRNA is trapped in a Channel Up formation, implying that a breakout is Imminent. This is a great…
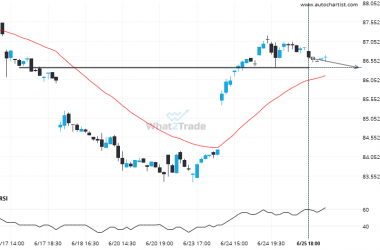
If BIDU touches 86.3600 it may be time to take action.
The price of BIDU in heading back to the support area. It is possible that it will struggle…