


Browsing Category
US Stocks
6657 posts
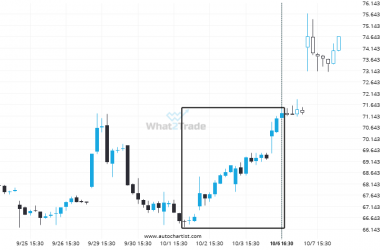
Big bullish swing on PYPL – this may be one of its more notable movements in the recent session.
PYPL reached 71.24 after a 7.18% move spanning 5 days.
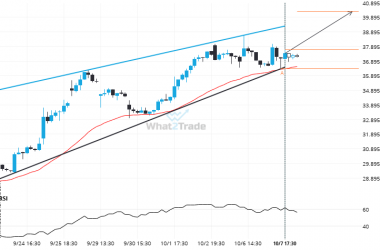
INTC formed a Rising Wedge on the 1 hour chart. Retest of resistance in sight.
Emerging Rising Wedge pattern in its final wave was identified on the INTC 1 hour chart. After a…
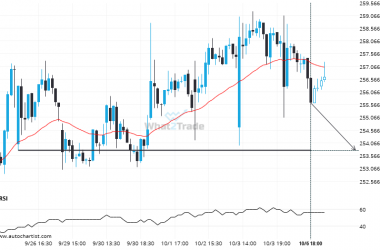
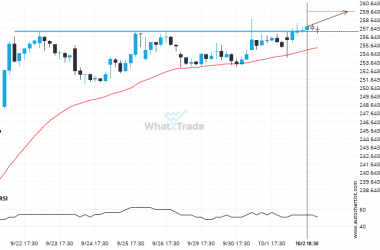
AAPL likely to test 253.7800 in the near future. Where to next?
AAPL is approaching a support line at 253.7800. If it hits the support line, it may break through…
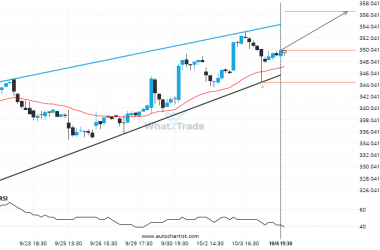
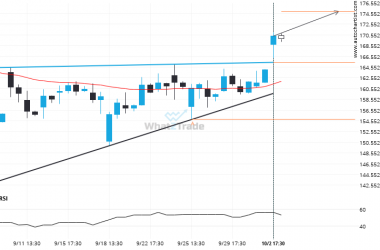
V formed a Rising Wedge on the 1 hour chart. Retest of resistance in sight.
V is heading towards the resistance line of a Rising Wedge and could reach this point within the…
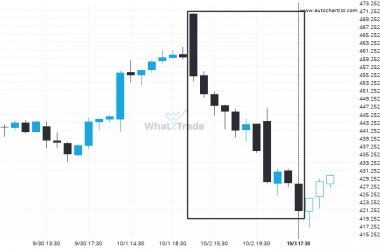
Extreme movement experienced on TSLA. Check the chart to see what to do next.
TSLA recorded a considerable move in the last day — one of its biggest in recent sessions.
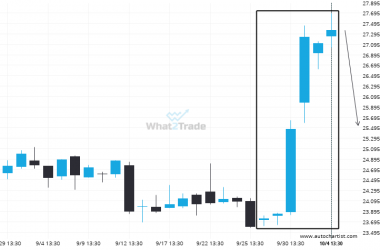
PFE has formed 6 bullish candles in a row.
PFE experienced a high number of bullish candles reaching 27.3650 over 9 days.
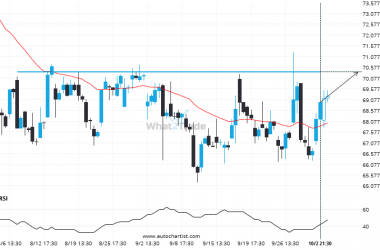
If PYPL touches 70.3750 it may be time to take action.
A strong resistance level has been identified at 70.3750 on the 4 hour PYPL chart. PYPL is likely…
If you’re short AAPL you should be aware that 257.2950 has just been breached – a level tested 3 time in the past
AAPL is once again retesting a key horizontal resistance level at 257.2950. It has tested this level 3…
AMD – breach of a trending resistance line that has been tested at least twice before.
The breakout of AMD through the resistance line of a Ascending Triangle could be a sign of the…
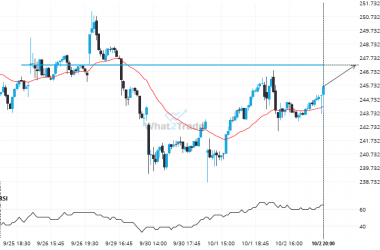
GOOGL keeps moving closer towards 247.2200. Will it finally breach this level?
GOOGL is moving towards a line of 247.2200 which it has tested numerous times in the past. We…