
Browsing Category
Uncategorized
616 posts
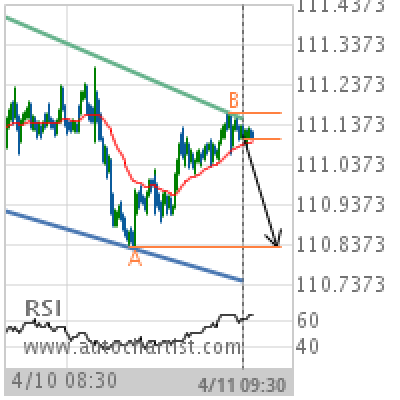
USD/JPY Target Level: 110.8300
Channel Down identified at 11-Apr-2019 09:30 UTC. This pattern is still in the process of forming. Possible bearish price movement towards the support 110.8300 within the next 18 hours. Supported by RSI above 60 Chart 15 MinutesPattern Channel DownLength 228 CandlesIdentified 11-Apr-2019 09:30 UTC
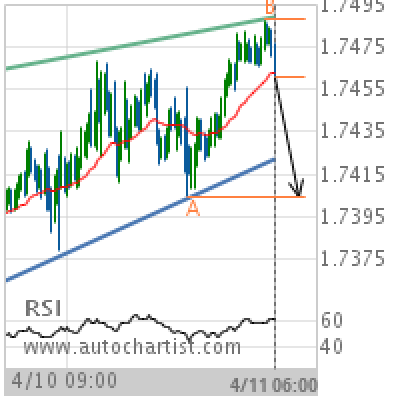
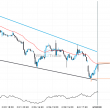
GBP/CAD Target Level: 1.7404
Rising Wedge identified at 11-Apr-2019 06:00 UTC. This pattern is still in the process of forming. Possible bearish price movement towards the support 1.7404 within the next 15 hours. Supported by RSI above 60 Chart 15 MinutesPattern Rising WedgeLength 181 CandlesIdentified 11-Apr-2019 06:00 UTC
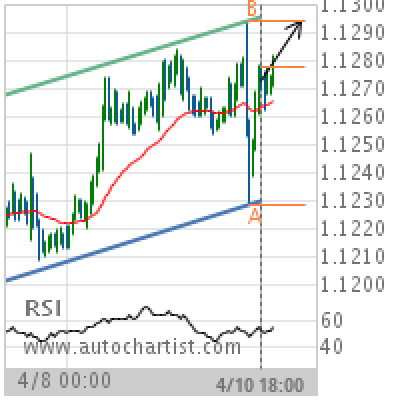
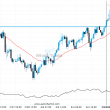
EUR/USD Target Level: 1.1294
Channel Up identified at 10-Apr-2019 18:00 UTC. This pattern is still in the process of forming. Possible bullish price movement towards the resistance 1.1294 within the next 2 days. Supported by Upward sloping Moving Average Chart 1 hourPattern Channel UpLength 146 CandlesIdentified 10-Apr-2019 18:00 UTC
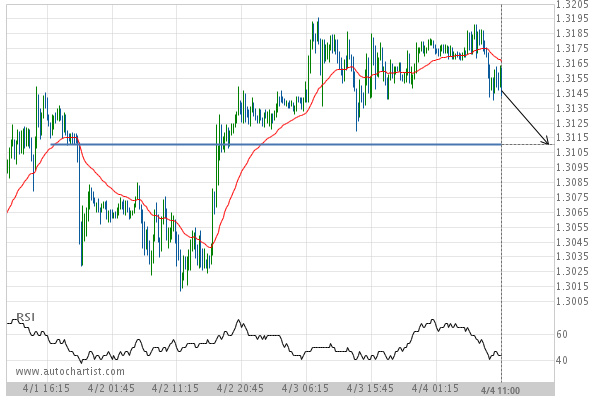
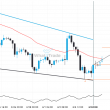
GBP/USD Target Level: 1.3111
Approaching Support level of 1.3111 identified at 04-Apr-2019 11:00 UTC
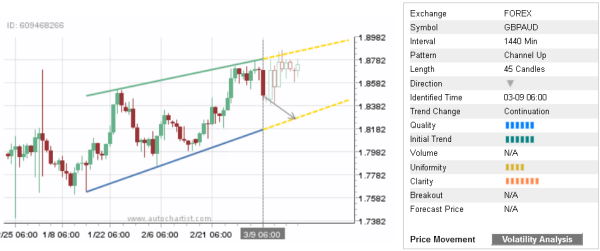
Trade of the Day: GBP/AUD
By: Dima Chernovolov GBP/AUD continues to fall inside the daily Up Channel chart pattern which was previously identified by Autochartist. Autochartist rates the quality of this Up Channel at the 7-bar level – which is the result of the significant Initial Trend (7 bars), lower Uniformity (4 bars) and strong Clarity (8 bars). GBP/AUD is…
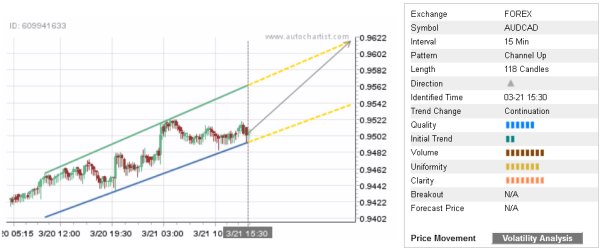
Trade of the Day: AUD/CAD
By: Dima Chernovolov AUD/CAD continues to rise inside the 15-minute Up Channel chart pattern which was previously identified by Autochartist. Autochartist rates the quality of this Up Channel at the 7-bar level – which is the result of the slow Initial Trend (2 bars), strong Uniformity (7 bars) and near-maximum Clarity (8 bars). AUD/CAD is…
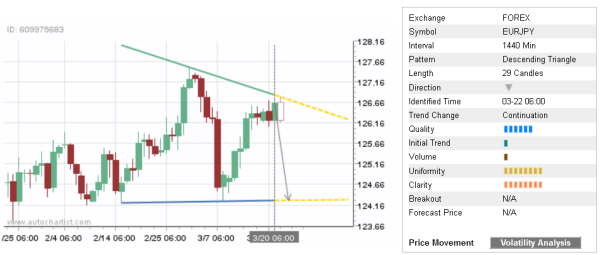
Trade of the Day: EUR/JPY
By: Dima Chernovolov EUR/JPY continues to fall inside the daily Descending Triangle chart pattern which was previously identified by Autochartist. Autochartist rates the quality of this Descending Triangle at the 6-bar level – which is the result of the strong Initial Trend and Uniformity (8 bars). EUR/JPY is expected to fall further inside this Descending…
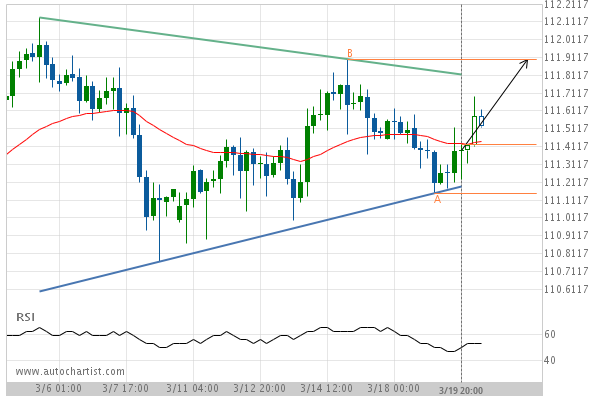
USD/JPY Target Level: 111.9010
Triangle identified at 19-Mar-2019 20:00 UTC. This pattern is still in the process of forming. Possible bullish price movement towards the resistance 111.9010 within the next 3 days. Supported by Upward sloping Moving Average Chart 4 hourPattern TriangleLength 63 CandlesIdentified 19-Mar-2019 20:00 UTC
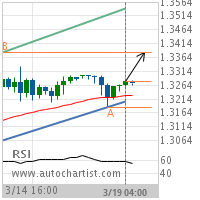
GBP/USD Target Level: 1.3383
Channel Up identified at 19-Mar-2019 04:00 UTC. This pattern is still in the process of forming. Possible bullish price movement towards the resistance 1.3383 within the next 2 days. Supported by Upward sloping Moving Average Chart 4 hourPattern Channel UpLength 35 CandlesIdentified 19-Mar-2019 04:00 UTC