
Browsing Category
Uncategorized
616 posts
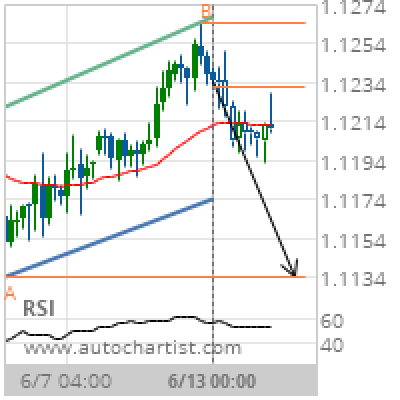
EUR/CHF Target Level: 1.1134
Channel Up identified at 13-Jun-2019 00:00 UTC. This pattern is still in the process of forming. Possible bearish price movement towards the support 1.1134 within the next day. Supported by Downward sloping Moving Average Chart 4 hourPattern Channel UpLength 47 CandlesIdentified 13-Jun-2019 00:00 UTC
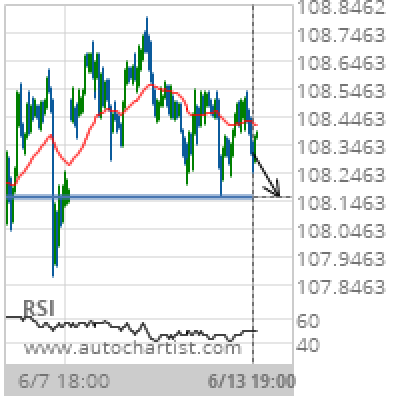
USD/JPY Target Level: 108.1580
Approaching Support level of 108.1580 identified at 13-Jun-2019 19:00 UTC Supported by Downward sloping Moving Average Chart 1 hourPattern SupportLength 213 CandlesIdentified 13-Jun-2019 19:00 UTC
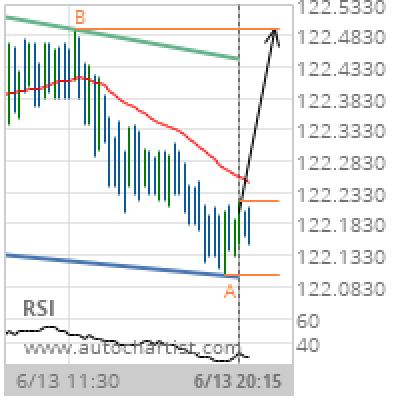
EUR/JPY Target Level: 122.4920
Channel Down identified at 13-Jun-2019 20:15 UTC. This pattern is still in the process of forming. Possible bullish price movement towards the resistance 122.4920 within the next 7 hours. Supported by RSI below 40 Chart 15 MinutesPattern Channel DownLength 80 CandlesIdentified 13-Jun-2019 20:15 UTC
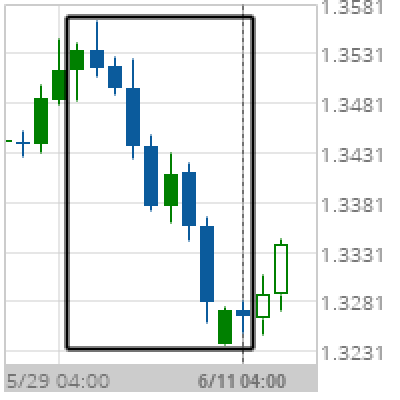
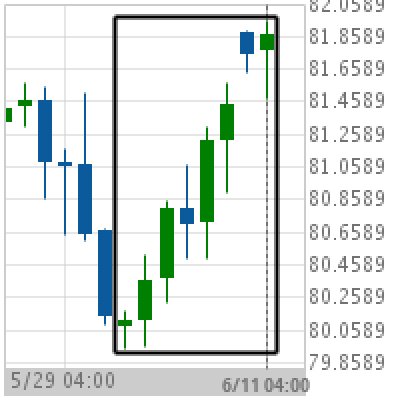
Big Movement USD/CAD
USD/CAD experienced a 1.84% bearish movement in the last 12 days. Chart DailyPattern Big MovementLength 10 CandlesIdentified 11-Jun-2019 04:00 UTC
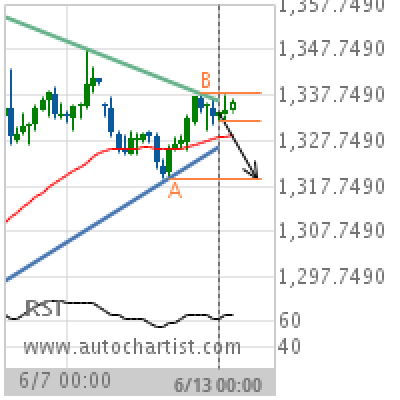
XAU/USD Target Level: 1319.4000
Triangle identified at 13-Jun-2019 00:00 UTC. This pattern is still in the process of forming. Possible bearish price movement towards the support 1319.4000 within the next 3 days. Supported by RSI above 60 Chart 4 hourPattern TriangleLength 59 CandlesIdentified 13-Jun-2019 00:00 UTC
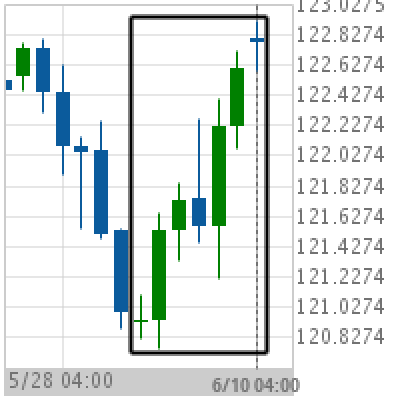
Big Movement CAD/JPY
CAD/JPY experienced a 2.23% bullish movement in the last 9 days. Chart DailyPattern Big MovementLength 8 CandlesIdentified 11-Jun-2019 04:00 UTC
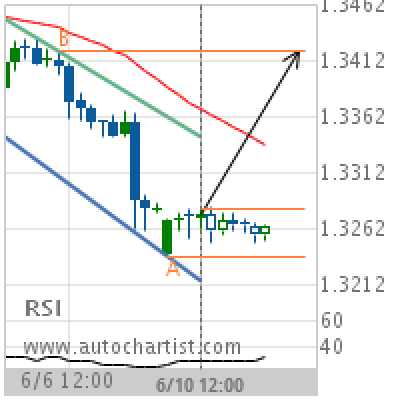
USD/CAD Target Level: 1.3419
Channel Down identified at 10-Jun-2019 12:00 UTC. This pattern is still in the process of forming. Possible bullish price movement towards the resistance 1.3419 within the next 15 hours. Supported by RSI below 40 Chart 4 hourPattern Channel DownLength 31 CandlesIdentified 10-Jun-2019 12:00 UTC
Big Movement EUR/JPY
EUR/JPY experienced a 1.53% bullish movement in the last 8 days. Chart DailyPattern Big MovementLength 7 CandlesIdentified 10-Jun-2019 04:00 UTC
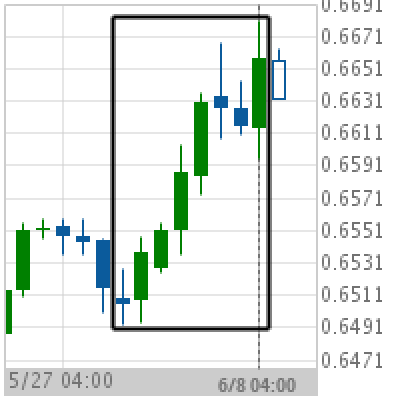
Big Movement NZD/USD
NZD/USD experienced a 2.29% bullish movement in the last 9 days. Chart DailyPattern Big MovementLength 8 CandlesIdentified 08-Jun-2019 04:00 UTC
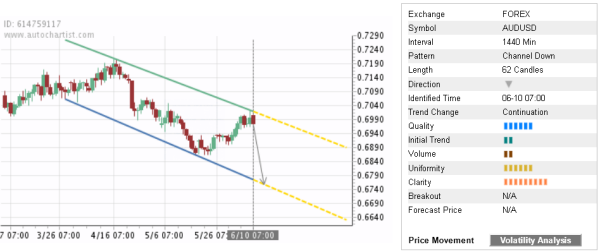
Trade of the Day: AUD/USD
By: Dima Chernovolov AUD/USD continues to fall inside the daily Down Channel chart pattern which was previously identified by Autochartist. Autochartist rates the quality of this Down Channel at the 7-bar level – which is the result of the slow Initial Trend (2 bars), above-average (6 bars) and strong Clarity (8 bars). AUD/USD is expected…