


Browsing Category
Uncategorized
616 posts
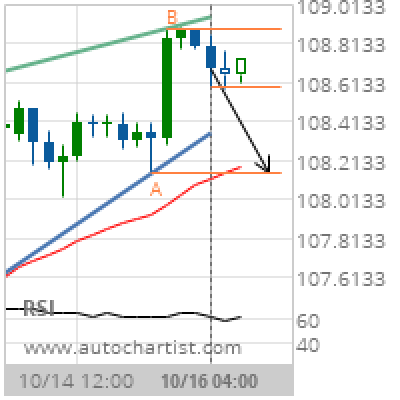
USD/JPY Target Level: 108.1480
Rising Wedge identified at 16-Oct-2019 04:00 UTC. This pattern is still in the process of forming. Possible bearish price movement towards the support 108.1480 within the next day. Supported by RSI above 60 Chart 4 hourPattern Rising WedgeLength 26 CandlesIdentified 16-Oct-2019 04:00 UTC
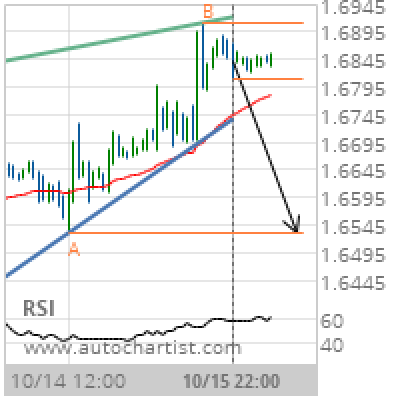
GBP/CAD Target Level: 1.6532
Rising Wedge identified at 15-Oct-2019 22:00 UTC. This pattern is still in the process of forming. Possible bearish price movement towards the support 1.6532 within the next 18 hours. Supported by RSI above 60 Chart 1 hourPattern Rising WedgeLength 79 CandlesIdentified 15-Oct-2019 22:00 UTC
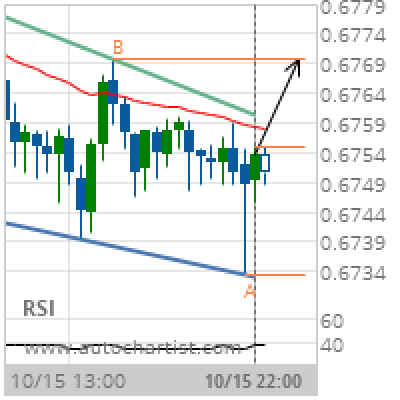
AUD/USD Target Level: 0.6769
Falling Wedge identified at 15-Oct-2019 22:00 UTC. This pattern is still in the process of forming. Possible bullish price movement towards the resistance 0.6769 within the next 7 hours. Supported by RSI below 40 Chart 30 MinutesPattern Falling WedgeLength 40 CandlesIdentified 15-Oct-2019 22:00 UTC
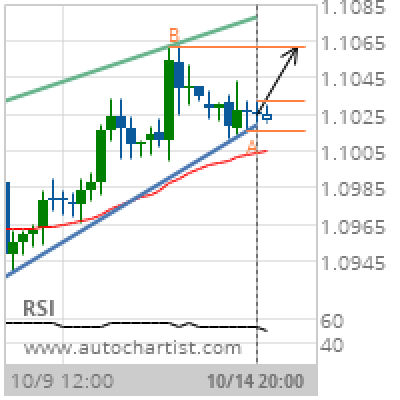
EUR/USD Target Level: 1.1062
Rising Wedge identified at 14-Oct-2019 20:00 UTC. This pattern is still in the process of forming. Possible bullish price movement towards the resistance 1.1062 within the next 2 days. Supported by Upward sloping Moving Average Chart 4 hourPattern Rising WedgeLength 45 CandlesIdentified 14-Oct-2019 20:00 UTC
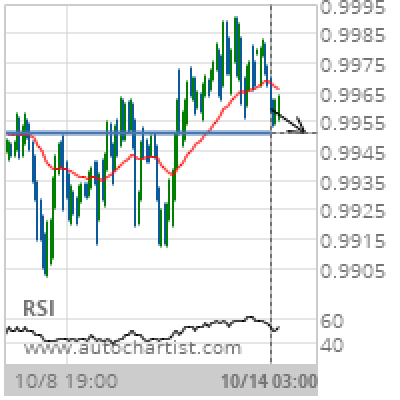
USD/CHF Target Level: 0.9951
Approaching Support level of 0.9951 identified at 14-Oct-2019 03:00 UTC Supported by Downward sloping Moving Average Chart 1 hourPattern SupportLength 173 CandlesIdentified 14-Oct-2019 03:00 UTC
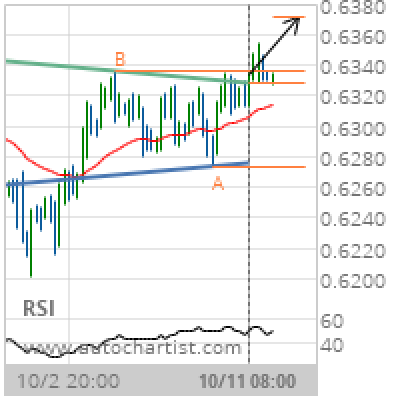
NZD/USD Target Level: 0.6371
Inverse Head and Shoulders has broken through the resistance line at 11-Oct-2019 08:00 UTC. Possible bullish price movement forecast for the next 2 days towards 0.6371. Supported by Upward sloping Moving Average Chart 4 hourPattern Inverse Head and ShouldersLength 90 CandlesIdentified 11-Oct-2019 08:00 UTC
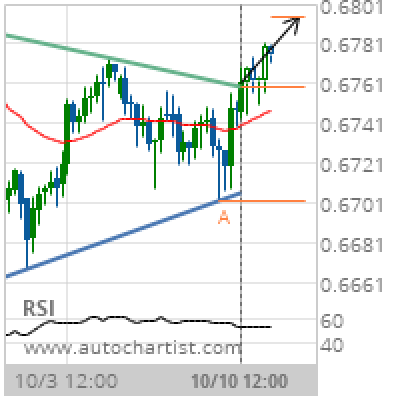
AUD/USD Target Level: 0.6795
Triangle has broken through the resistance line at 10-Oct-2019 12:00 UTC. Possible bullish price movement forecast for the next 3 days towards 0.6795. Supported by Upward sloping Moving Average Chart 4 hourPattern TriangleLength 70 CandlesIdentified 10-Oct-2019 12:00 UTC
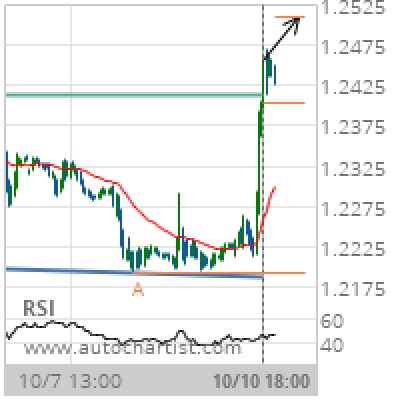
GBP/USD Target Level: 1.2509
Double Bottom has broken through the resistance line at 10-Oct-2019 18:00 UTC. Possible bullish price movement forecast for the next 2 days towards 1.2509. Supported by Upward sloping Moving Average Chart 1 hourPattern Double BottomLength 172 CandlesIdentified 10-Oct-2019 18:00 UTC
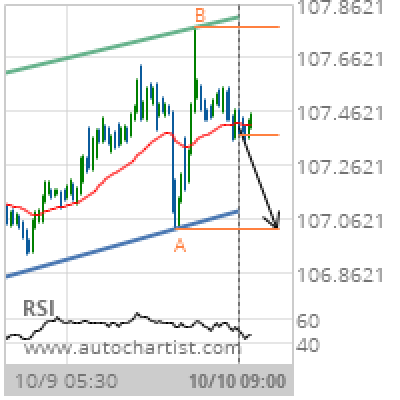
USD/JPY Target Level: 107.0240
Channel Up identified at 10-Oct-2019 09:00 UTC. This pattern is still in the process of forming. Possible bearish price movement towards the support 107.0240 within the next 19 hours. Supported by Downward sloping Moving Average Chart 30 MinutesPattern Channel UpLength 126 CandlesIdentified 10-Oct-2019 09:00 UTC
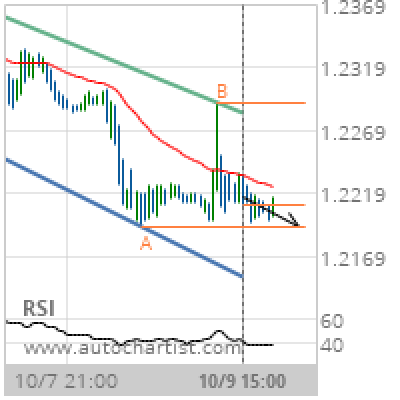
GBP/USD Target Level: 1.2193
Channel Down identified at 09-Oct-2019 15:00 UTC. This pattern is still in the process of forming. Possible bearish price movement towards the support 1.2193 within the next day. Supported by Downward sloping Moving Average Chart 1 hourPattern Channel DownLength 96 CandlesIdentified 09-Oct-2019 15:00 UTC