

Browsing Category
Global Indices
6663 posts
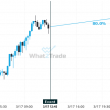
Breach of 38559.0000 could mean a start of a bullish trend on US30
US30 has broken through a line of 38559.0000 and suggests a possible movement to 38857.1016 within the next…
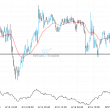
NAS100 broke through a resistance at 2024-05-02T19:00:00.000Z, with the price momentum continuing to move in an upward direction over the next hours, good opportunity presents itself with the price expected to reach 17707.6292.
NAS100 has broken through a resistance line of a Falling Wedge chart pattern. If this breakout holds true,…
Important price line breached by UK100. This price has been tested numerous times before.
UK100 has broken through a line of 8175.0000 and suggests a possible movement to 8203.5996 within the next…
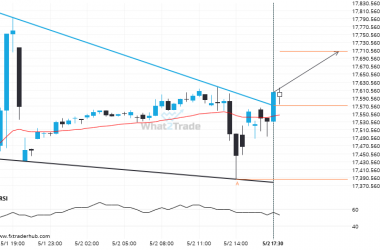
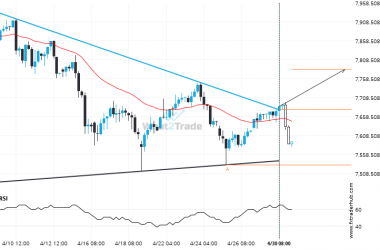
FRA40 breakout from a Triangle trade setup. Will it continue this trend to hit the target price?
The last 15 4 hour candles on FRA40 formed a Triangle pattern and broken out through the pattern…
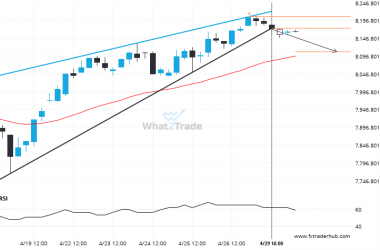
A final push possible on AUS200 as it starts approaching a price line of 7622.0000.
A strong resistance level has been identified at 7622.0000 on the 30 Minutes AUS200 chart. AUS200 is likely…

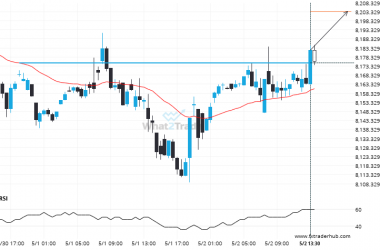
Breach of 8168.0000 could mean a start of a bullish trend on UK100
UK100 has broken through a line of 8168.0000. If this breakout holds true, we could see the price…
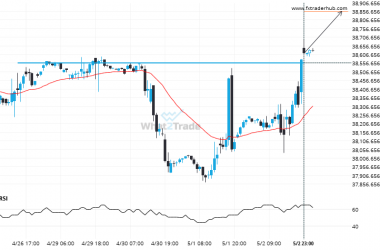
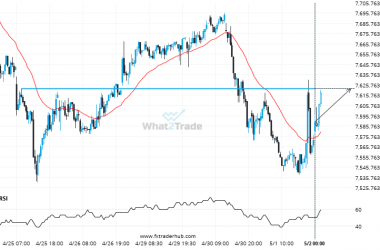
AUS200 through 7676.813559322033. Is this a confirming a breakout? Will it continue its path in the current trend toward 7783.6417?
AUS200 has broken through a resistance line. It has touched this line at least twice in the last…
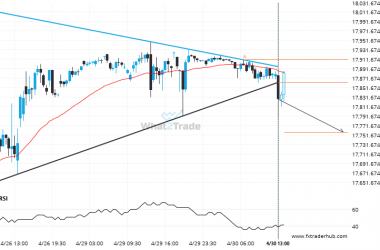
NAS100 – breach of a trending support line that has been tested at least twice before.
You would be well advised to confirm the breakout that has just occurred – do you believe the…
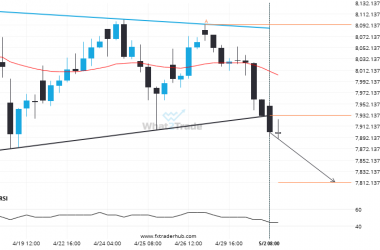
After testing support twice in the past, FRA40 has finally broken through. Can we expect a bearish trend to follow?
FRA40 has broken through a support line of a Triangle chart pattern. If this breakout holds true, we…
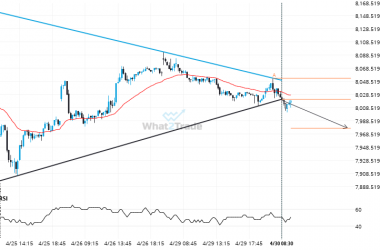
Support line breached by UK100. This price has been tested at least twice before.
UK100 has broken through a support line of a Rising Wedge chart pattern. If this breakout holds true,…