


Browsing Category
Global Indices
7095 posts
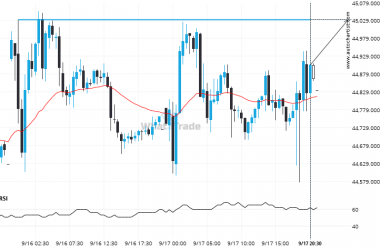
Supports and resistances are primary concepts of technical analysis. Nikkei 225 is heading for an important price of 45031.0000 – read about what this could mean for the future.
Nikkei 225 is moving towards a line of 45031.0000 which it has tested numerous times in the past.…
After testing the resistance line numerous times, ASX 200 is once again approaching this line. Can we expect a bullish trend to follow?
ASX 200 is heading towards the resistance line of a Channel Up. If this movement continues, the price…
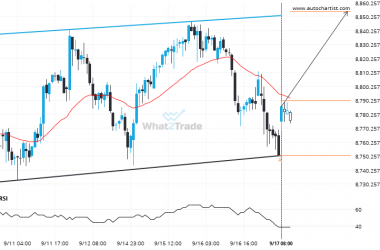
If you’re long FTSE 100 you should be aware of the rapidly approaching level of 9105.0000
FTSE 100 is about to retest a key horizontal support level near 9105.0000. It has tested this level…
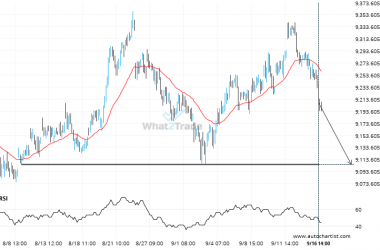
DOW 30 formed a Falling Wedge on the 15 Minutes chart. Retest of support in sight.
DOW 30 is heading towards the support line of a Falling Wedge and could reach this point within…
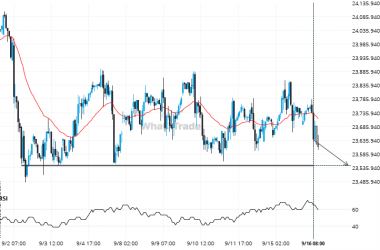
DAX 40 keeps moving closer towards 23544.0000. Will it finally breach this level?
DAX 40 is moving towards a line of 23544.0000 which it has tested numerous times in the past.…
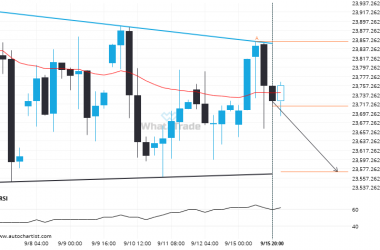
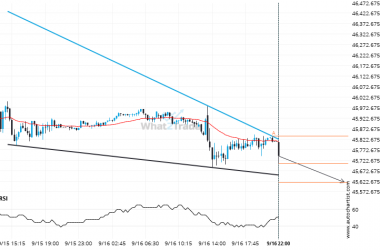
A Descending Triangle has formed, DAX 40 is approaching resistance. Can we expect a breakout and the start of a new trend or a reversal?
DAX 40 is moving towards a support line which it has tested numerous times in the past. We…
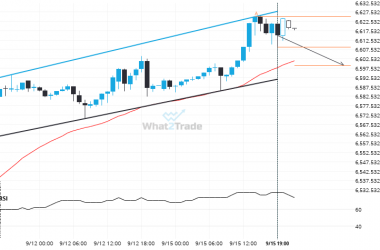
US 500 formed a Channel Up on the 1 hour chart. Retest of support in sight.
US 500 is trapped in a Channel Up formation, implying that a breakout is Imminent. This is a…
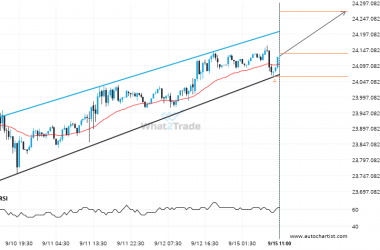
Because NAS 100 formed a Channel Up pattern, we expect it to touch the resistance line. If it breaks through resistance it may move much higher
NAS 100 is approaching the resistance line of a Channel Up. It has touched this line numerous times…
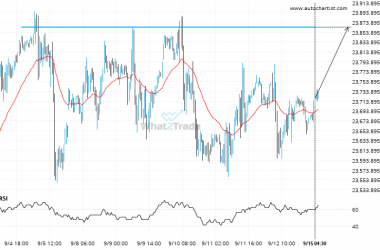
DAX 40 keeps moving closer towards 23863.9004. Will it finally breach this level?
DAX 40 is about to retest a key horizontal resistance level near 23863.9004. It has tested this level…
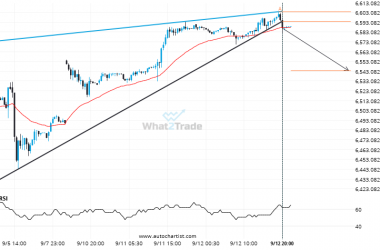
Breach of support could mean a start of a bearish trend on US 500
This trade setup on US 500 is formed by a period of consolidation; a period in which the…