


Browsing Category
Global Indices
7095 posts
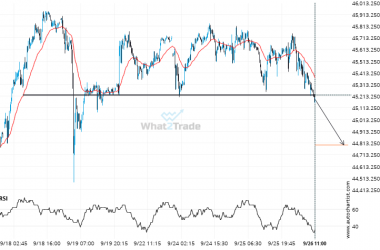
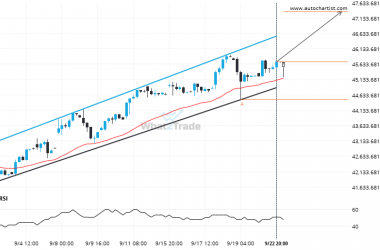
Nikkei 225 may be on a start of a new bearish trend after its breakout through this important support level
Nikkei 225 is once again retesting a key horizontal support level at 45225.0000. It has tested this level…
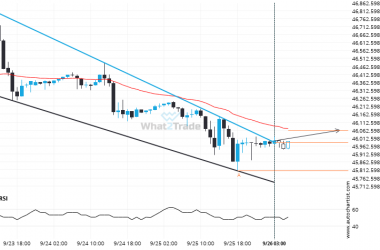
DOW 30 has broken through resistance of a Falling Wedge. It has touched this line at least twice in the last 3 days.
The breakout of DOW 30 through the resistance line of a Falling Wedge could be a sign of…
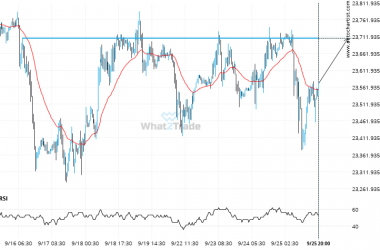
A final push possible on DAX 40 as it starts approaching a price line of 23706.9004.
DAX 40 is moving towards a line of 23706.9004 which it has tested numerous times in the past.…
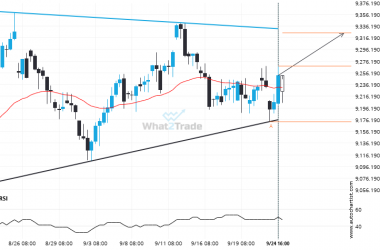
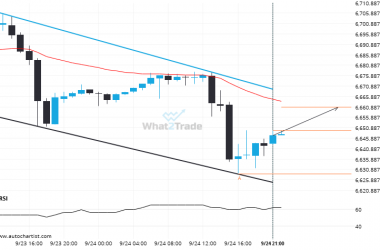
Because FTSE 100 formed a Triangle pattern, we expect it to touch the resistance line. If it breaks through resistance it may move much higher
FTSE 100 is approaching the resistance line of a Triangle. It has touched this line numerous times in…
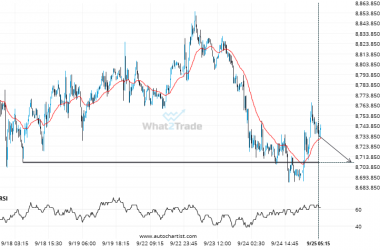
ASX 200 is approaching 8708.2002. We expect either a breakout through this line, or a rebound.
The movement of ASX 200 towards 8708.2002 price line is yet another test of the line it reached…
Because US 500 formed a Flag pattern, we expect it to touch the resistance line. If it breaks through resistance it may move much higher
US 500 is trapped in a Flag formation, implying that a breakout is Imminent. This is a great…
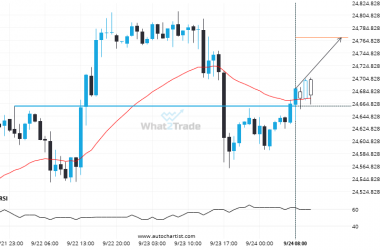
NAS 100 – breach of price line that’s been previously tested numerous times before
NAS 100 has broken through 24660.3613 which it has tested numerous times in the past. We have seen…
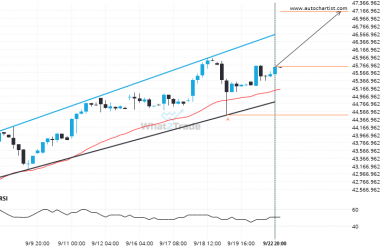
After testing the resistance line numerous times, Nikkei 225 is once again approaching this line. Can we expect a bullish trend to follow?
Nikkei 225 was identified at around 45715.0 having recently rebounded of the support on the 4 hour data…
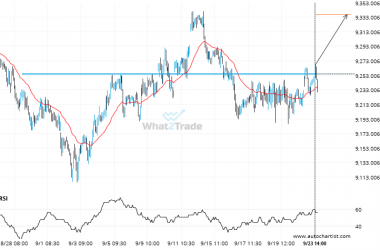
FTSE 100 is currently testing a level of 9254.6602. Will the breakout continue or will things reverse?
FTSE 100 has broken through a resistance line. It has touched this line numerous times in the last…
Nikkei 225 is signaling a possible trend reversal on the intraday charts with price not breaching support.
Nikkei 225 is trapped in a Channel Up formation, implying that a breakout is Imminent. This is a…