


Browsing Category
Global Indices
6645 posts
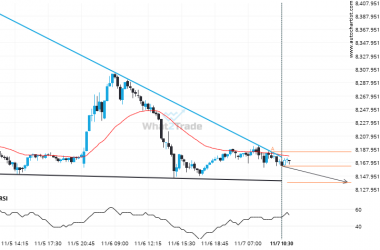
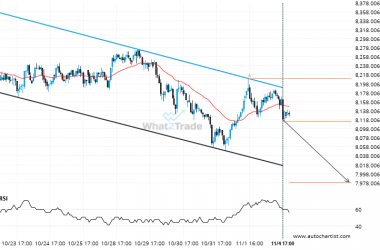
FTSE 100 is quickly approaching the support line of a Descending Triangle. We expect either a breakout through this line or a rebound.
FTSE 100 is heading towards the support line of a Descending Triangle. If this movement continues, the price…
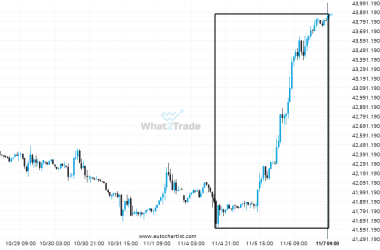
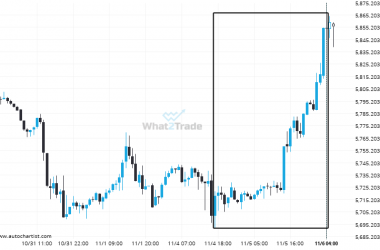
DOW 30 – It’s perhaps in these huge moves where the greatest opportunity lies
DOW 30 hits 43849.88 after a 5.29% move spanning 3 days.
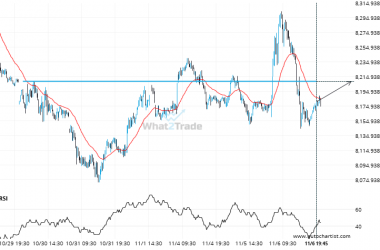
Important price line being approached by FTSE 100. This price has been tested numerous times before.
FTSE 100 is moving towards a resistance line. Because we have seen it retrace from this level in…
After testing the support line numerous times, ASX 200 is once again approaching this line. Can we expect a bearish trend to follow?
ASX 200 is moving towards a support line which it has tested numerous times in the past. We…
Extreme movement experienced on US 500. Check this chart to see what to do next
Those of you that are trend followers are probably eagerly watching US 500 to see if its latest…
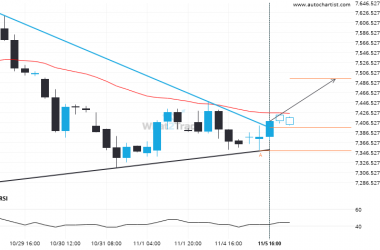
CAC 40 has broken through resistance of a Triangle. It has touched this line at least twice in the last 12 days.
Triangle pattern identified on CAC 40 has broken through a resistance level with the price momentum continuing to…
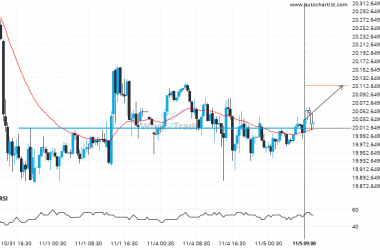
NAS 100 has broken through a resistance line. It has touched this line numerous times in the last 5 days.
NAS 100 has broken through a resistance line. Because we have seen it retrace from this price in…
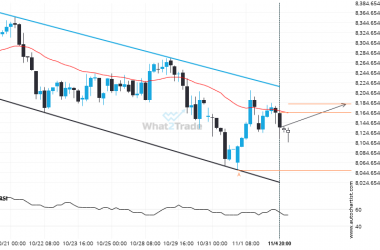
ASX 200 is approaching a resistance line of a Channel Down. It has touched this line numerous times in the last 32 days.
Emerging Channel Down pattern in its final wave was identified on the ASX 200 4 hour chart. After…
A possible move on ASX 200 as it heads towards support
An emerging Channel Down has been detected on ASX 200 on the 1 hour chart. There is a…
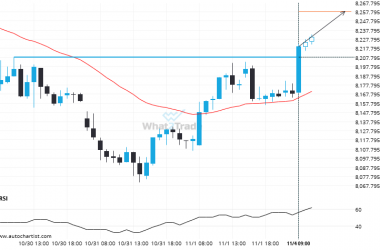
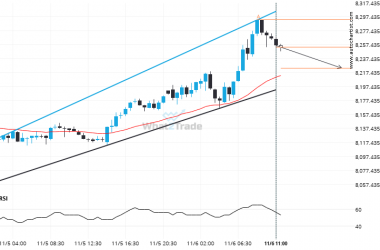
After testing 8208.1201 numerous times, FTSE 100 has finally broken through. Can we expect a bullish trend to follow?
FTSE 100 has broken through a resistance line. It has touched this line numerous times in the last…