Browsing Category
Global Indices
6645 posts
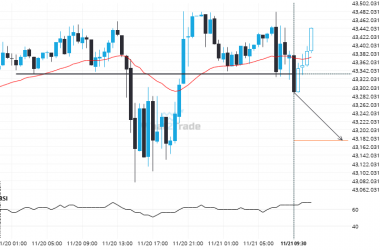
After trying numerous times in the past, DOW 30 finally breaks 43334.1797!
DOW 30 has breached the support line at 43334.1797. It may continue the bearish trend towards 43176.8516, or,…
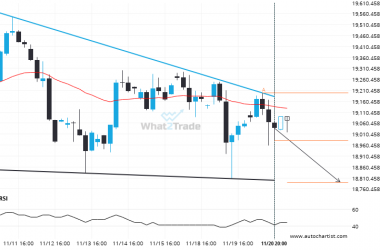
A Descending Triangle has formed, DAX 40 is approaching resistance. Can we expect a breakout and the start of a new trend or a reversal?
DAX 40 is moving towards a support line which it has tested numerous times in the past. We…
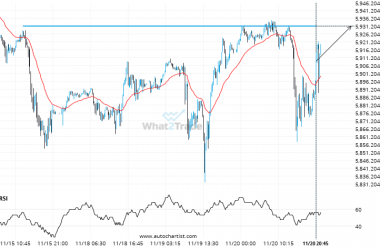
After testing 5931.2900 numerous times, US 500 is once again approaching this price point. Can we expect a bullish trend to follow?
US 500 is heading towards 5931.2900 and could reach this point within the next 18 hours. It has…
A possible move by US 500 towards 5937.3157
This trade setup on US 500 is formed by a period of consolidation; a period in which the…
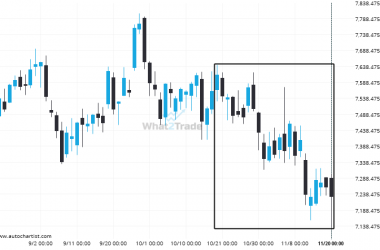
CAC 40 moves lower to 7229.3 in the last 34 days.
An unexpected large move has occurred on CAC 40 Daily chart beginning at 7612.3 and ending at 7229.3.…
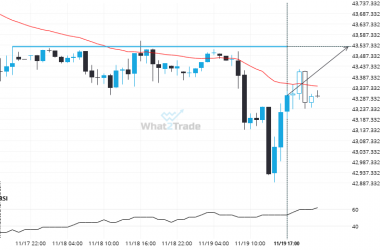
Important price line being approached by DOW 30. This price has been tested numerous times before.
DOW 30 is heading towards 43529.8984 and could reach this point within the next 5 hours. It has…
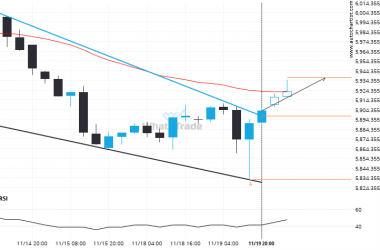
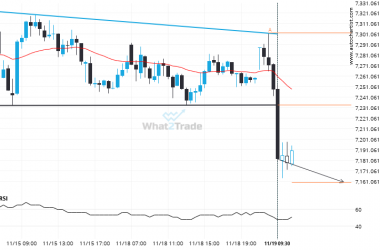
CAC 40 has broken through support of a Descending Triangle. It has touched this line at least twice in the last 5 days.
This trade setup on CAC 40 is formed by a period of consolidation; a period in which the…
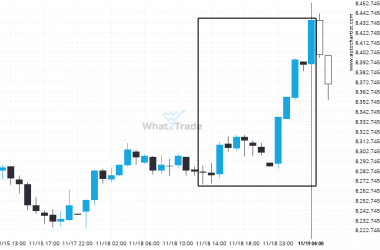
Extreme movement experienced on ASX 200. Check this chart to see what to do next
ASX 200 has moved higher by 1.86% from 8280.7 to 8434.9 in the last 15 hours.
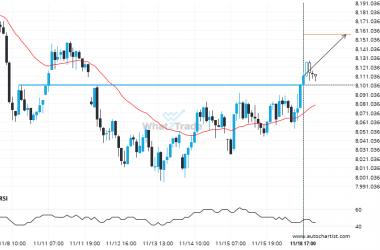
FTSE 100 – breach of price line that’s been previously tested numerous times before
FTSE 100 has broken through 8101.2998 which it has tested numerous times in the past. We have seen…
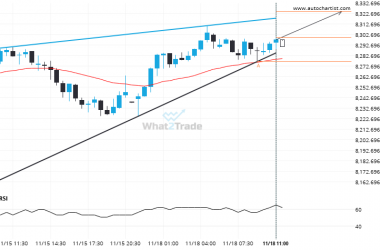
Because ASX 200 formed a Rising Wedge pattern, we expect it to touch the resistance line. If it breaks through resistance it may move much higher
The movement of ASX 200 towards the resistance line of a Rising Wedge is yet another test of…

