
Browsing Category
Futures
10911 posts
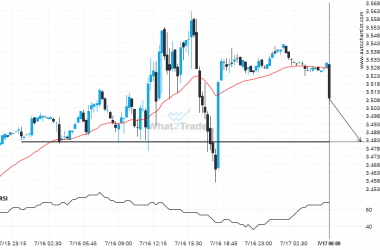
If Natural Gas touches 3.4825 it may be time to take action.
Natural Gas is moving towards a support line. Because we have seen it retrace from this level in…
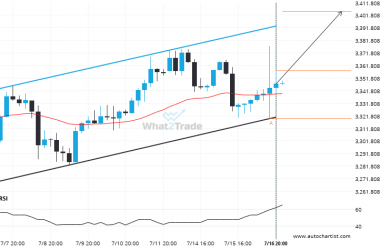
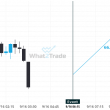
Gold Spot is approaching a resistance line of a Channel Up. It has touched this line numerous times in the last 10 days.
Gold Spot is moving towards a resistance line. Because we have seen it retrace from this line before,…
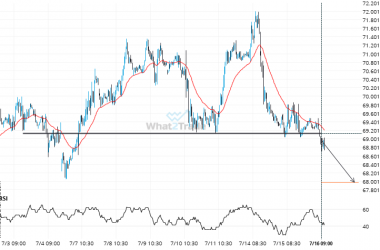
Breach of 69.1315 could mean a start of a bearish trend on Brent Crude
Brent Crude has broken through 69.1315 which it has tested numerous times in the past. We have seen…
Important support line being approached by Brent Crude. This price has been tested numerous time in the last 2 days
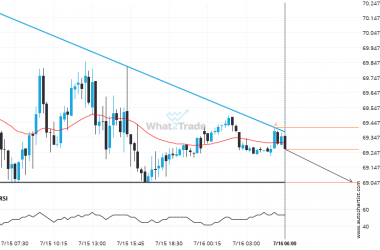
An emerging Descending Triangle has been detected on Brent Crude on the 15 Minutes chart. There is a…
A Descending Triangle has formed, Brent Crude is approaching resistance. Can we expect a breakout and the start of a new trend or a reversal?
Brent Crude is moving towards a support line which it has tested numerous times in the past. We…
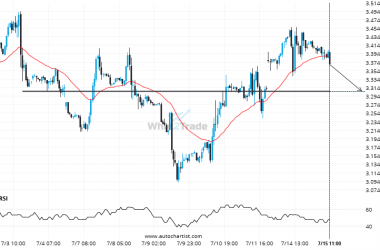
Natural Gas is quickly approaching a very important level it has previously tested numerous times in the past
Natural Gas is approaching a support line at 3.3060. If it hits the support line, it may break…
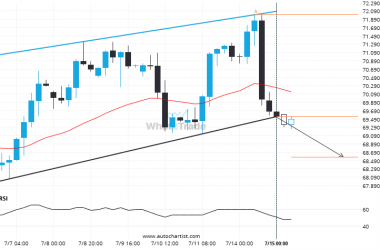
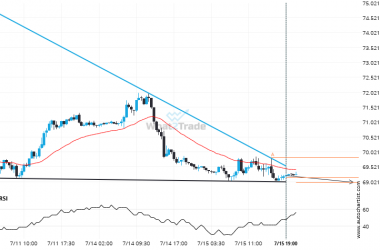
There is a possibility of a big movement on Brent Crude after a breach of the support
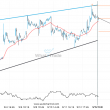
The last 23 4 hour candles on Brent Crude formed a Channel Up pattern and broken out through…
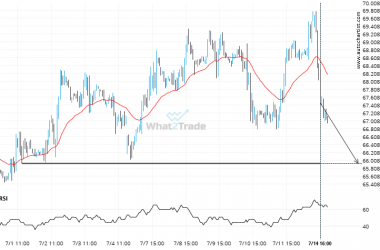
Will US Oil break through the support level it tested before?
US Oil is about to retest a key horizontal support level near 65.9310. It has tested this level…
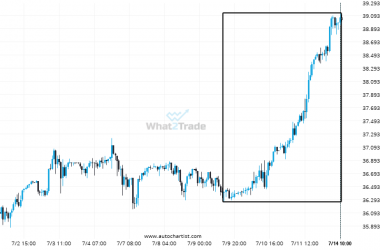
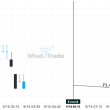
Silver Spot experienced a very large 5 days bullish move to 39.062.
Silver Spot has moved higher by 7.3% from 36.406 to 39.062 in the last 5 days.
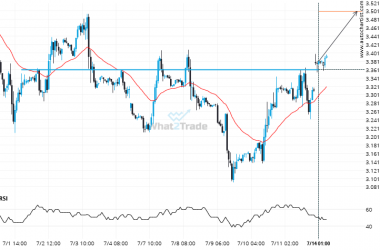
After testing 3.3610 numerous times, Natural Gas has finally broken through. Can we expect a bullish trend to follow?
Natural Gas has broken through 3.3610 which it has tested numerous times in the past. We have seen…