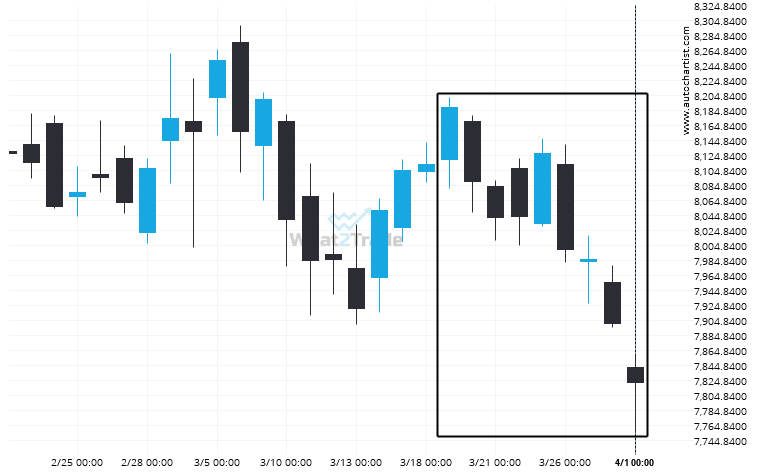
CAC 40 dropped sharply for 13 days – which is an excessively big movement for this instrument; exceeding the 98% of past price moves. Even if this move is a sign of a new trend in CAC 40 there is a chance that we will witness a correction, no matter how brief.
ARTÍCULOS RELACIONADOS
FTSE 100 moves higher to 8830.28 in the last 65 days.
FTSE 100 hits 8830.28 after a 15.02% move spanning 65 days.
Because CAC 40 formed a Triangle pattern, we expect it to touch the resistance line. If it breaks through resistance it may move much higher
CAC 40 is approaching the resistance line of a Triangle. It has touched this line numerous times in…
Breach of 6008.0898 could mean a start of a bullish trend on US 500
US 500 has broken through 6008.0898 which it has tested numerous times in the past. We have seen…