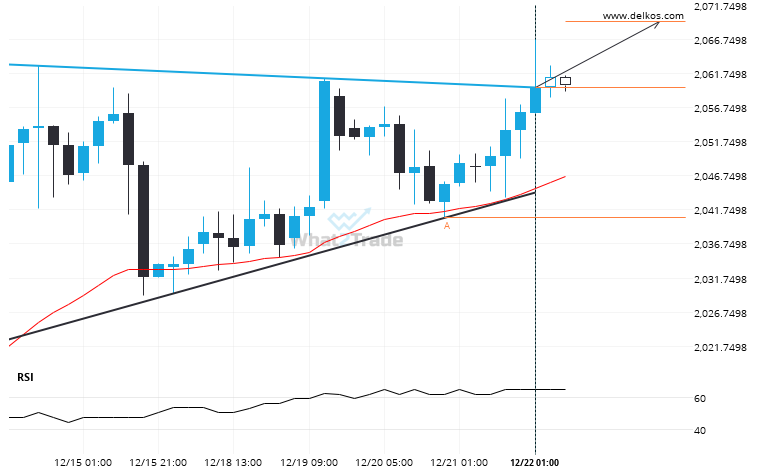
Gold February 2024 moved through the resistance line of a Ascending Triangle at 2059.6 on the 4 hour chart. This line has been tested a number of times in the past and this breakout could mean an upcoming change from the current trend. It may continue in its current direction toward 2069.3661.
ARTÍCULOS RELACIONADOS
Gold Spot keeps moving closer towards 3361.2500. Will it finally breach this level?
A strong support level has been identified at 3361.2500 on the 1 hour Gold Spot chart. Gold Spot…
Natural Gas is approaching a resistance line of a Channel Up. It has touched this line numerous times in the last 3 days.
Natural Gas was identified at around 3.7895 having recently rebounded of the support on the 15 Minutes data…
Big movement possible on Silver Spot after a breach of 36.4546
The price of Silver Spot in heading in the direction of 37.3478. Despite the recent breakout through 36.4546…