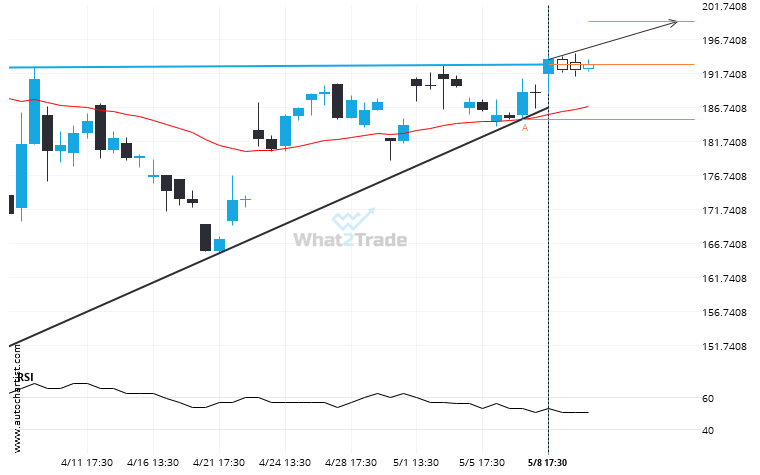
AMZN has broken through the resistance line of a Ascending Triangle technical chart pattern. Because we have seen it retrace from this line in the past, one should wait for confirmation of the breakout before taking any action. It has touched this line twice in the last 32 days and suggests a possible target level to be around 199.3513 within the next 21 hours.
ARTÍCULOS RELACIONADOS
Breach of support could mean a start of a bearish trend on BABA
BABA has broken through a support line. It has touched this line at least twice in the last…
TSLA is quickly approaching the support line of a Channel Up. We expect either a breakout through this line or a rebound.
Emerging Channel Up pattern in its final wave was identified on the TSLA 1 hour chart. After a…
Important price line being approached by ADBE. This price has been tested numerous times before.
ADBE is moving towards a key resistance level at 341.9750. ADBE has previously tested this level 3 times…