


BTCUSD has broken through the support line of a Triangle technical chart pattern. Because we have seen it retrace from this line in the past, one should wait for confirmation of the breakout before taking any action. It has touched this line twice in the last 20 hours and suggests a possible target level to be around 40480.9737 within the next 5 hours.

ARTÍCULOS RELACIONADOS
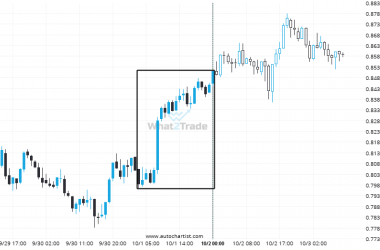
ADAUSD – Large moves like this tend to draw attention.
ADAUSD has moved higher by 6.6% from 0.7985 to 0.8512 in the last 21 hours.
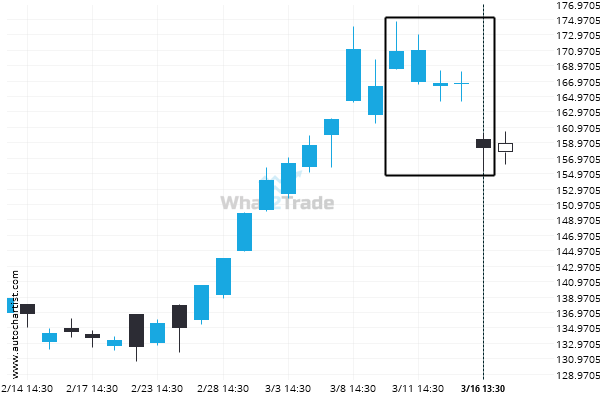
After testing the resistance line numerous times, BTCJPY is once again approaching this line. Can we expect a bullish trend to follow?
BTCJPY is moving towards a resistance line. Because we have seen it retrace from this line before, we…
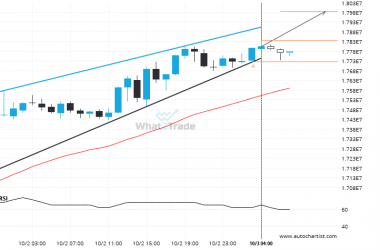
DASHEUR is quickly approaching a very important level it has previously tested numerous times in the past
The price of DASHEUR in heading back to the resistance area. It is possible that it will struggle…