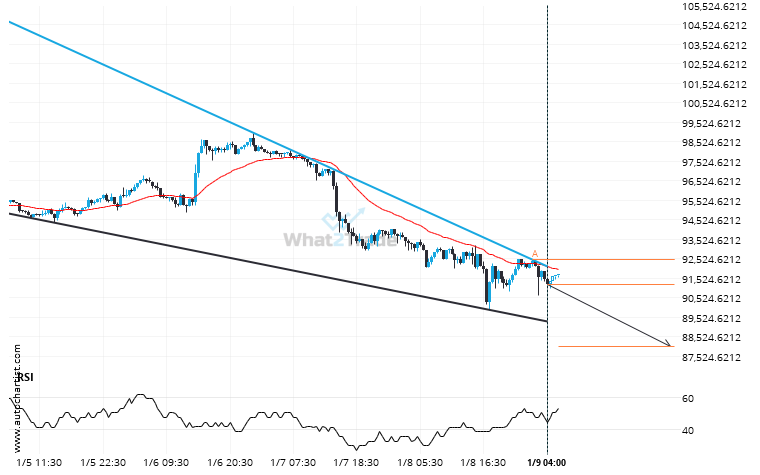
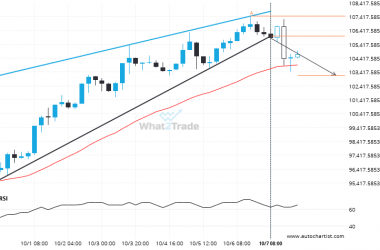
Emerging Falling Wedge pattern in its final wave was identified on the BTCEUR 30 Minutes chart. After a strong bearish run, we find BTCEUR heading towards the upper triangle line with a possible resistance at 88011.5640. If the support shows to hold, the Falling Wedge pattern suggests a rebound back towards current levels.
ARTÍCULOS RELACIONADOS
It’s time to make a decision on BTCJPY – its recent breach of 1.7665E+07 could be a sign of a new trend to follow.
BTCJPY has broken through a line of 1.7665E+07. If this breakout holds true, we could see the price…
LTCEUR formed a Triangle on the 4 hour chart. Retest of support in sight.
LTCEUR was identified at around 94.94 having recently rebounded of the resistance on the 4 hour data interval.…
If you’re short XRPUSD you should be aware of the rapidly approaching level of 3.1970
The price of XRPUSD in heading back to the resistance area. It is possible that it will struggle…